Figure 4. Begg’s funnel plot with the Egger’s test for publication bias for association of TGF-β levels in aqueous humor with risks
of POAG. The vertical line in the funnel plot indicates the fixed-effects summary estimate, whereas the diagonal lines represent
pseudo-95% confidence interval (CI) limits concerning the effect estimate. In the absence of publication bias, studies are
distributed symmetrically to the right and left of the vertical line. The blue symbols refer to the observed studies, while
the red is the imputed studies, that is, expected if larger numbers of studies with negative results have been included in
the analysis. A: Total transforming growth factor (TGF)-β levels in primary open-angle glaucoma (POAG), PEgger’s test=0.13 B: Active TGF-β levels in POAG, PEgger’s test=0.30.
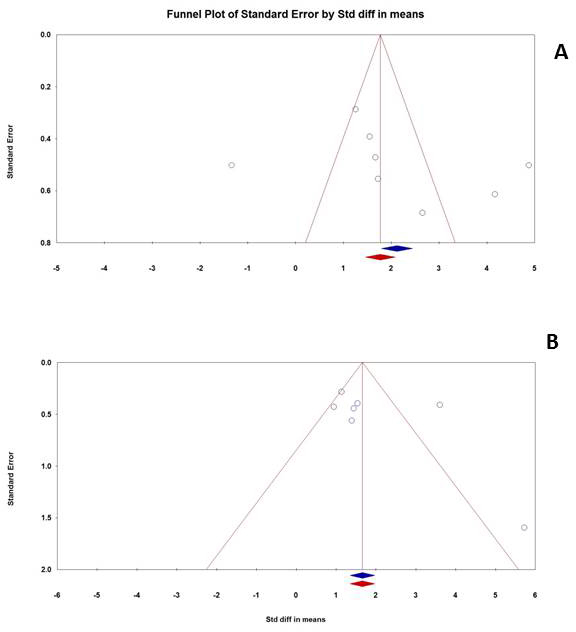
 Figure 4 of
Agarwal, Mol Vis 2015; 21:612-620.
Figure 4 of
Agarwal, Mol Vis 2015; 21:612-620.