Figure 1. Forest plot of the standardized mean difference and 95% CIs of the active TGF-β2 levels in aqueous humor between the patients
with POAG and the control subjects. The blue squares represent individual studies, and the size of the square represents the
weight given to each study in the meta-analysis. The black square represents the pooled estimate. The horizontal lines represent
95% confidence interval (CI). The pooled results showed that patients with primary open angle glaucoma had higher active transforming
growth factor (TGF)-β2 levels than the controls.
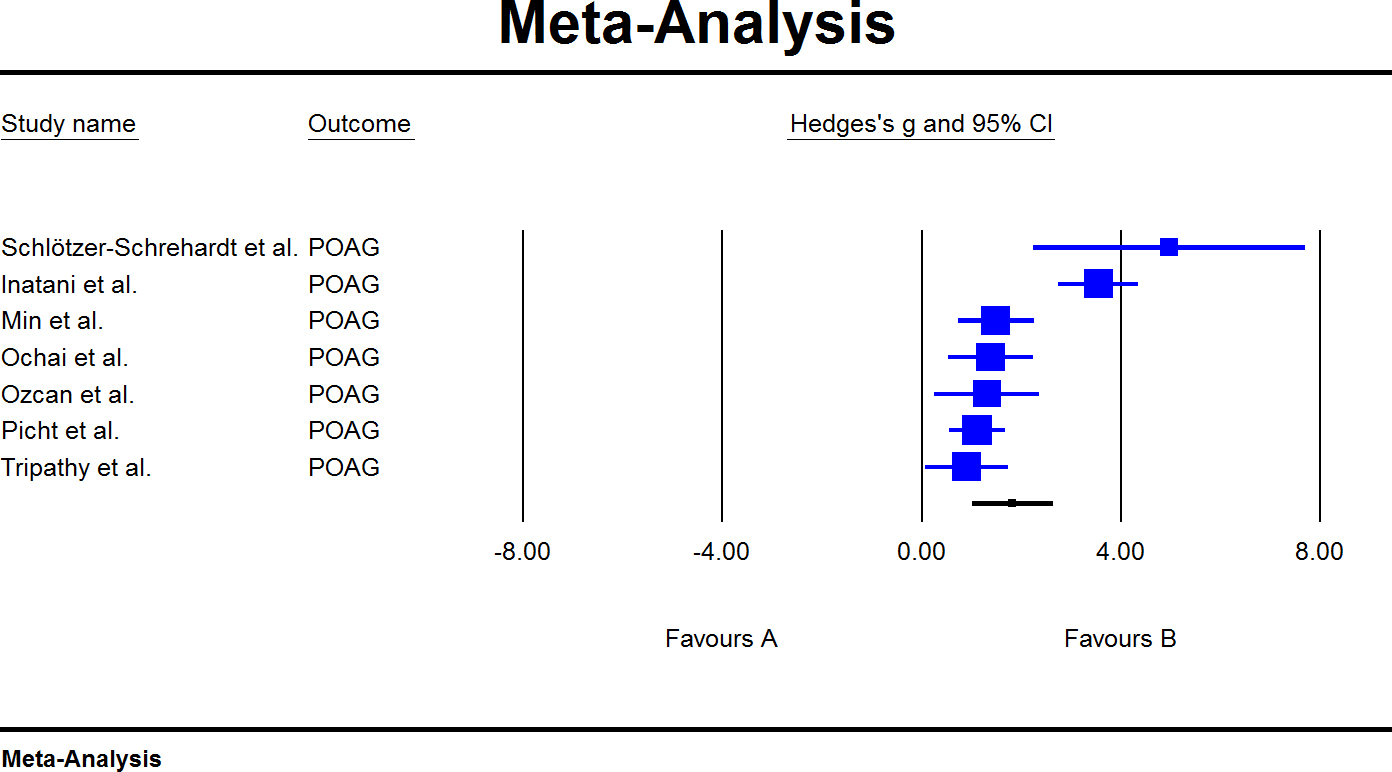
 Figure 1 of
Agarwal, Mol Vis 2015; 21:612-620.
Figure 1 of
Agarwal, Mol Vis 2015; 21:612-620.