Figure 4. Gene location box plot: Randomly chosen gene sets of 1,175 genes (up) and 1,387 (down) were run 1,000 times, and a median
intergenic distance across all of these runs was calculated. Intergenic distances are measured in terms of the average number
of genes between any two neighboring genes located on the same chromosome (y-axis). The median and interquartile range (IQR)
for the randomly selected gene sets are shown in the center of the box plots, with the whiskers showing 1.5× IQR. Outliers
from the randomly generated gene sets are shown as black circles; our real data sets are indicated via red diamond and are
more tightly clustered than would be expected by chance. A one-sample t test yielded p values <2.2e-16 for the up- and downregulated lists. The 95% confidence intervals are Up: 22.433 to 22.525,
Down: 19.103 to 19.175.
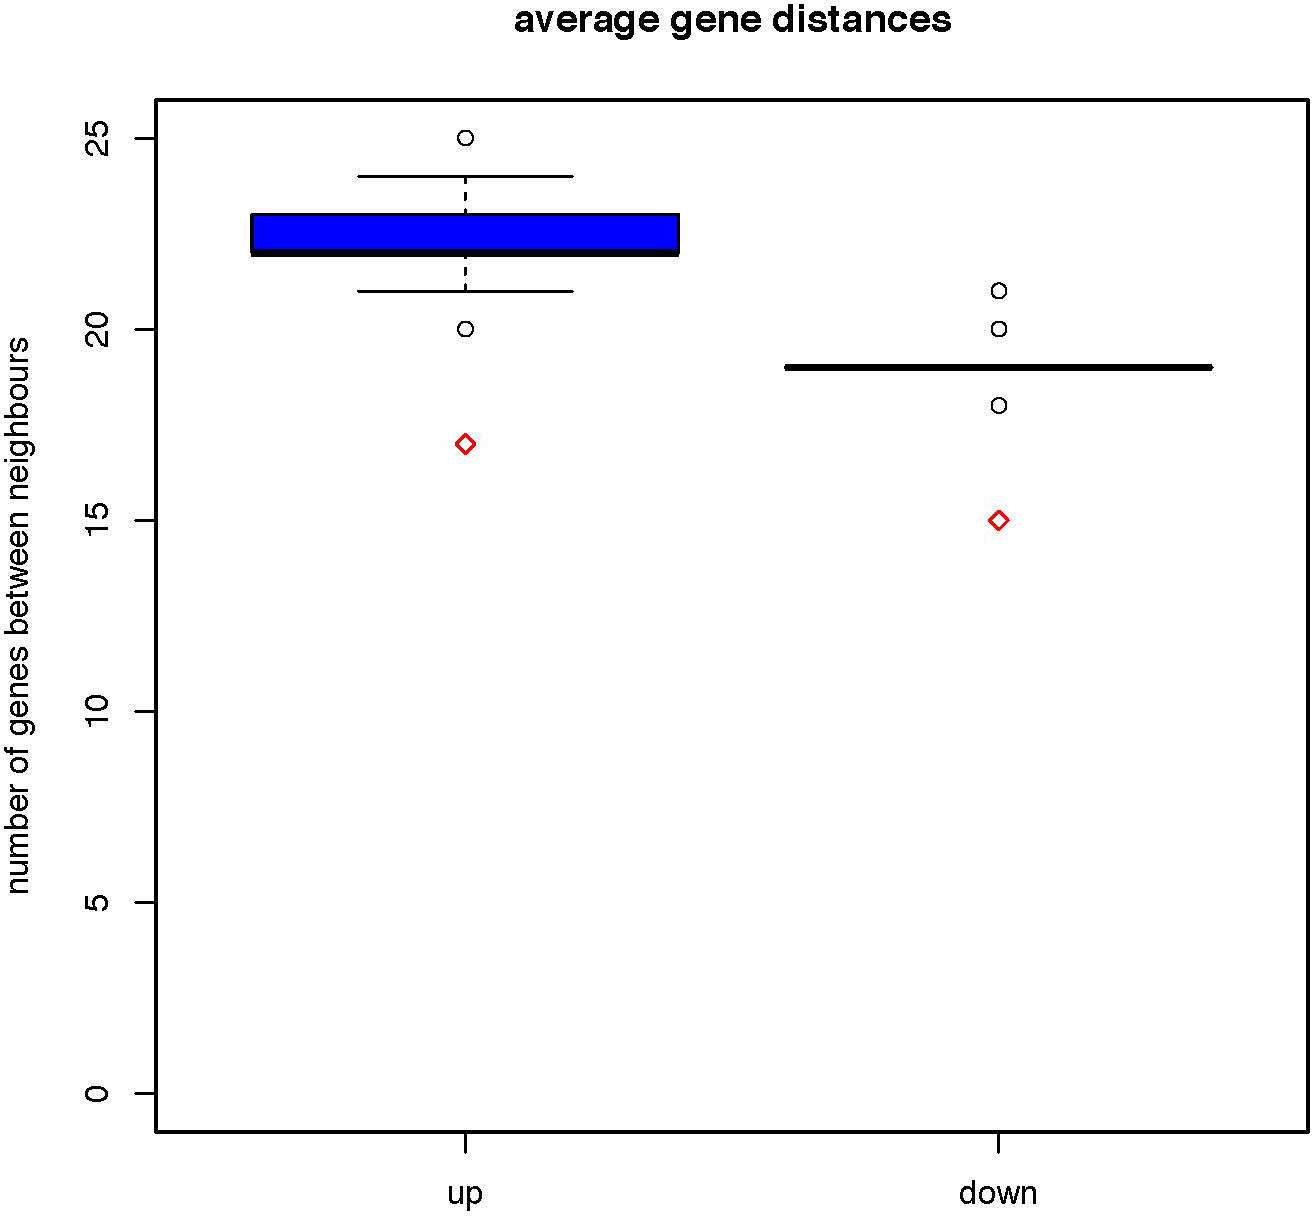
 Figure 4 of
Mansergh, Mol Vis 2015; 21:61-87.
Figure 4 of
Mansergh, Mol Vis 2015; 21:61-87.