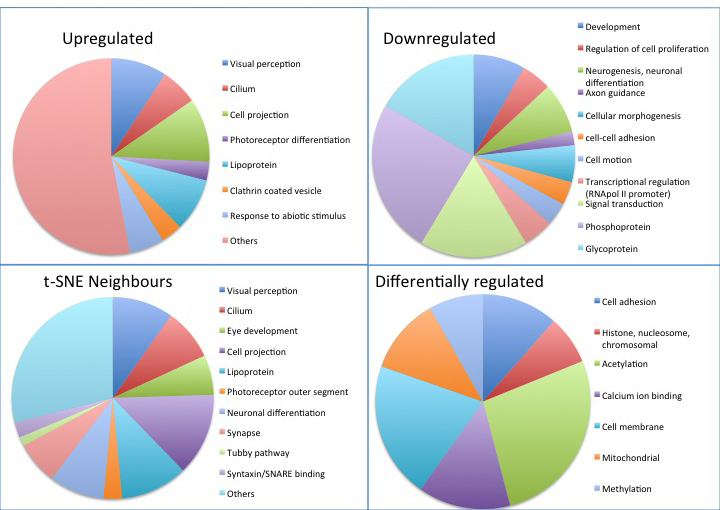
Figure 3. Functional breakdown of upregulated, downregulated, differentially regulated, and “neighbors” data sets. The differentially
regulated data set represents genes differentially regulated in all comparisons of retinal progenitor cells (RPCs) versus
P1, RPCs versus P5, P1 versus P5 but not significantly changed between fluorescence-activated cell sorting (FACS) positive
and negative samples. Pie charts were generated in MS Excel from the categories most significantly overrepresented in each
gene list (Benjamini corrected p value <0.01) as assessed with
DAVID.
 Figure 3 of
Mansergh, Mol Vis 2015; 21:61-87.
Figure 3 of
Mansergh, Mol Vis 2015; 21:61-87.