Figure 2. Q-PCR confirmation of expression pattern changes, selected genes. X-axis: samples; RPC=RPCs, P1=P1 retina, FACS-=Rho-eGFP
negative cells, FACS+=Rho-eGFP positive cells, P5=P5 retina, Ad ret=adult retina. Y-axis: normalized fold changes where P1
is set at 1. Since Rho-eGFP-negative cells are derived from all non-retinal cells other than rod photoreceptors, and do not
represent a pure cell type, we have shown more genes upregulated in Rho-eGFP-positive cells; these are also more likely to
be involved in retinitis pigmentosa (RP). This is not representative of the data set as a whole; numbers of up- and downregulated
genes are approximately equal. The q-PCR data for all genes tested are shown in Appendix 4.
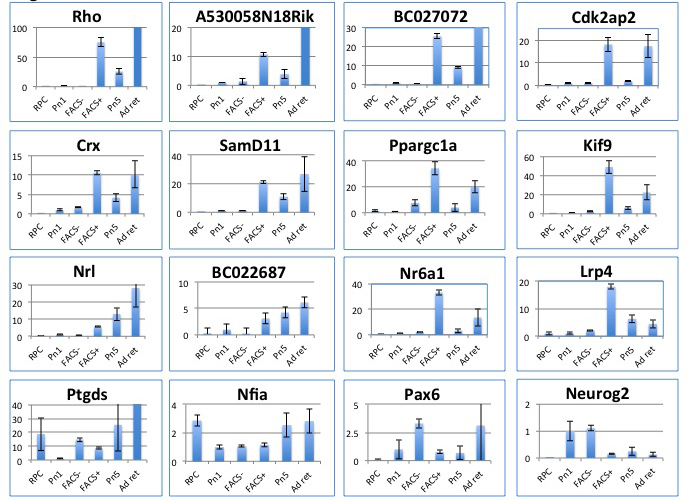
 Figure 2 of
Mansergh, Mol Vis 2015; 21:61-87.
Figure 2 of
Mansergh, Mol Vis 2015; 21:61-87.