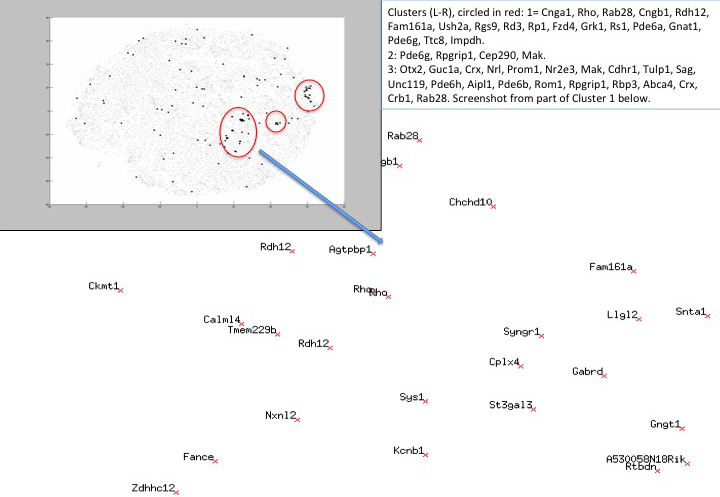
Figure 1. t-SNE map of gene expression patterns per gene for the whole data set. Retinal disease genes (
RetNet) are highlighted in black; other genes are shown in gray (top left-hand corner). Three clusters of retinal disease genes
are highlighted; the closest neighbors of the listed genes were selected for further study. The background shows a close-up
of the cluster containing
Rhodopsin and its closest neighbors. Some genes are represented by multiple probes. These genes are usually clustered close to each
other (e.g.,
Rho is shown twice at the center of the image). Any gene of interest can be located within the data set using the following link:
t-SNE.
 Figure 1 of
Mansergh, Mol Vis 2015; 21:61-87.
Figure 1 of
Mansergh, Mol Vis 2015; 21:61-87.