Figure 2. Dose curve of treatment with recombinant eNOS on NOS activity. Quiescent REC were treated with different doses of recombinant
eNOS under high glucose conditions and analyzed by ELISA for NOS activity. *p<0.05 versus HG control. n=3. Data are mean ±
SEM.
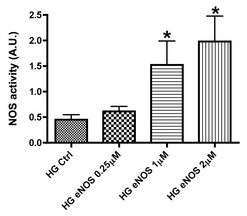
 Figure 2 of
Zhang, Mol Vis 2015; 21:604-611.
Figure 2 of
Zhang, Mol Vis 2015; 21:604-611.