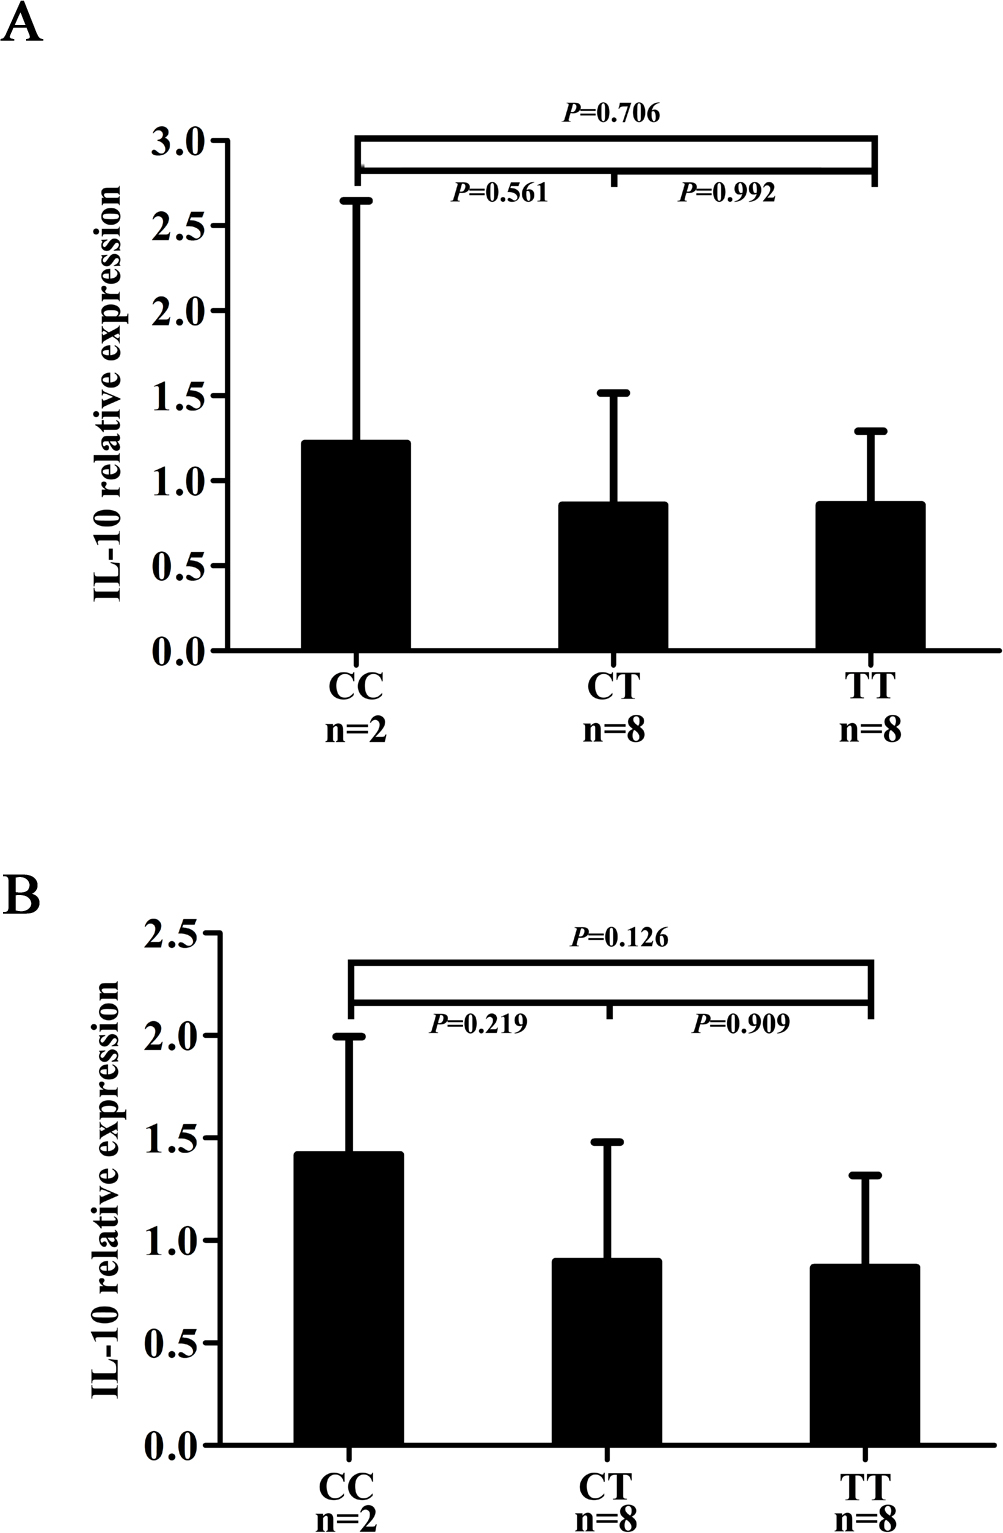
Figure 3. The expression of different genotypes of rs1800871/IL-10 at mRNA level in a stimulated condition by LPS or anti-CD3/CD28 antibodies.
A: The relative expression of IL-10 mRNA in LPS-stimulated PBMCs obtained from healthy controls with the known IL-10
rs1800871 genotype.
B: The relative expression of IL-10 mRNA by anti-CD3/CD28 antibody-stimulated PBMCs obtained from healthy controls with the
known IL-10
rs1800871 genotype. The y-axis represents the IL-10 mRNA relative expression level through the real-time PCR of each genotype. Data
are shown as mean ± SD. PBMCs included lymphocytes, such as T, B, and NK cells (90–95%), monocytes (3%), and Dendritic cells.
 Figure 3 of
Hu, Mol Vis 2015; 21:589-603.
Figure 3 of
Hu, Mol Vis 2015; 21:589-603.