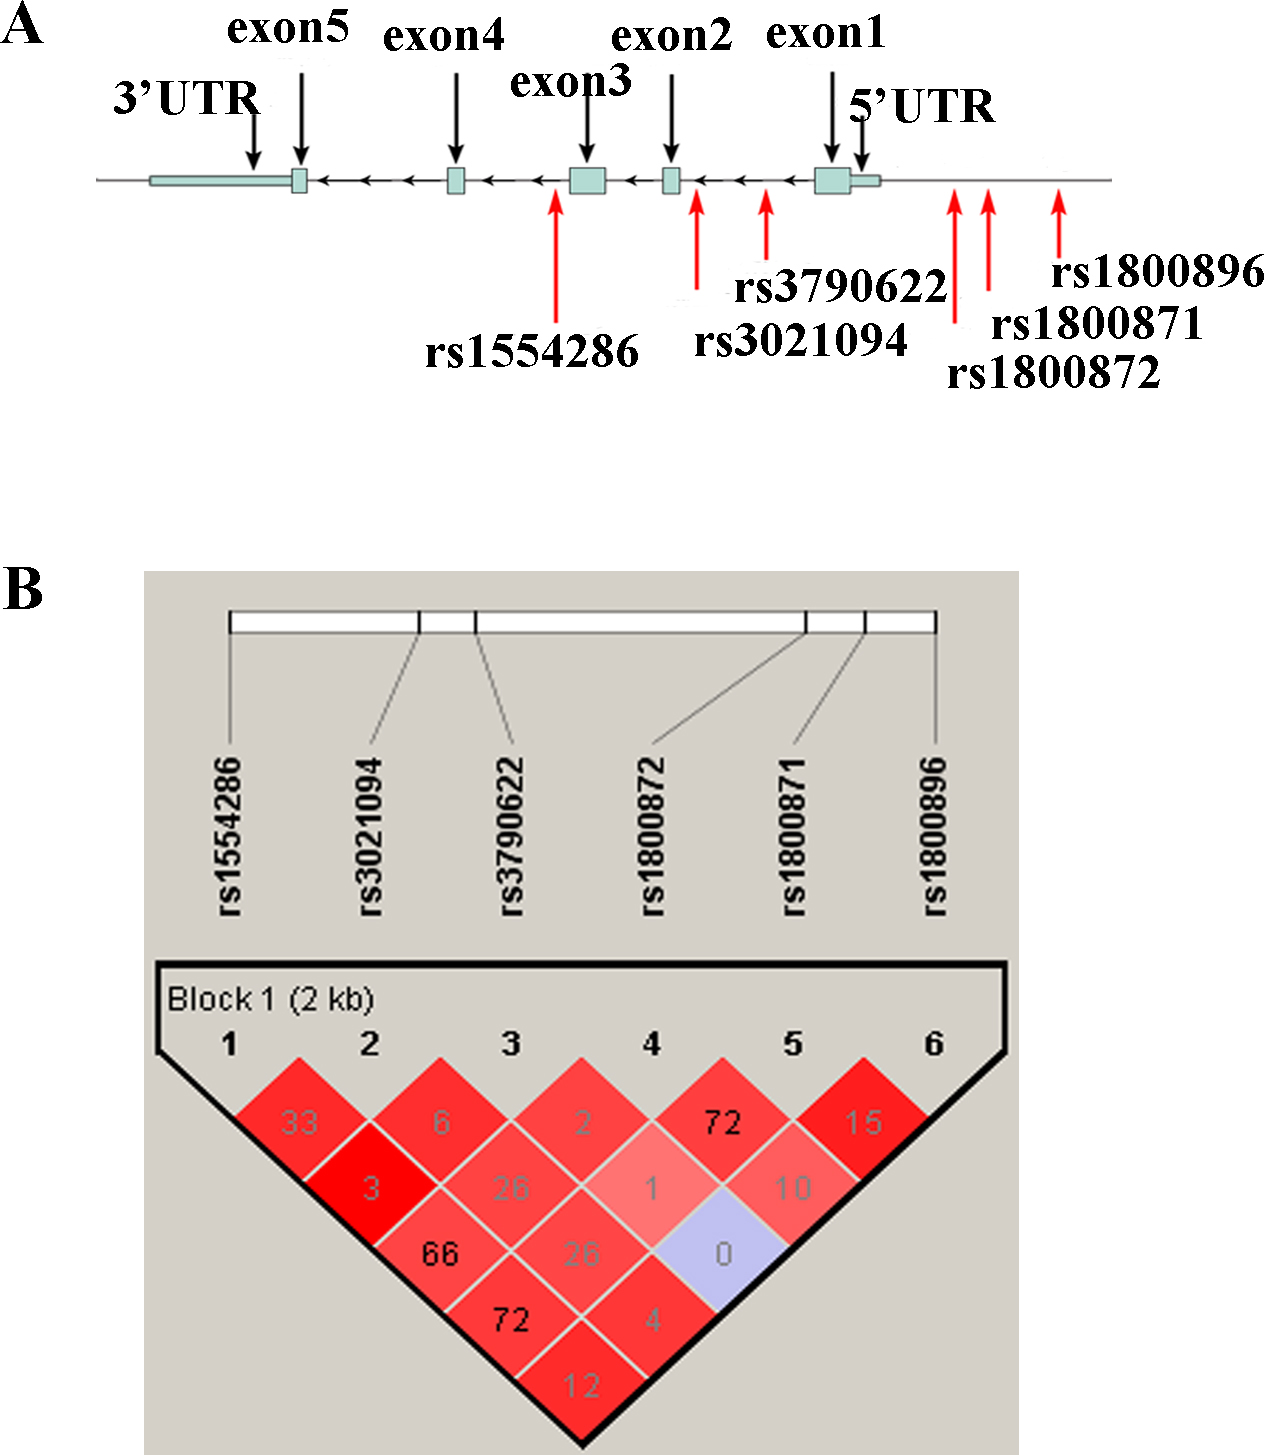
Figure 1. The relative positions of the investigated SNPs and the LD analysis of the examined SNPs of IL-10.
A: The relative positions of the investigated SNPs of IL10 tested in this study (red arrows).
B: An LD analysis was performed for SNPs
rs1800896,
rs1800871,
rs1800872,
rs3790622,
rs3021094, and
rs1554286 based on our data using Haploview software version 4.2. The number in the square indicates r
2 value.
 Figure 1 of
Hu, Mol Vis 2015; 21:589-603.
  Figure 1 of
Hu, Mol Vis 2015; 21:589-603.