Figure 4. RT-PCR analysis shows gene expression for (A) SMAD3 and (B) SMAD4. Representive western blots show protein expression for (C) SMAD3, (D) SMAD4 and (E) pSMAD3, following stimulation with all three TGF-β isoforms. F: Representative Western blots. All samples were repeated at least three times. p<0.05 was considered to be statistically
significant (***p<0.001, **p<0.01, *p<0.05).
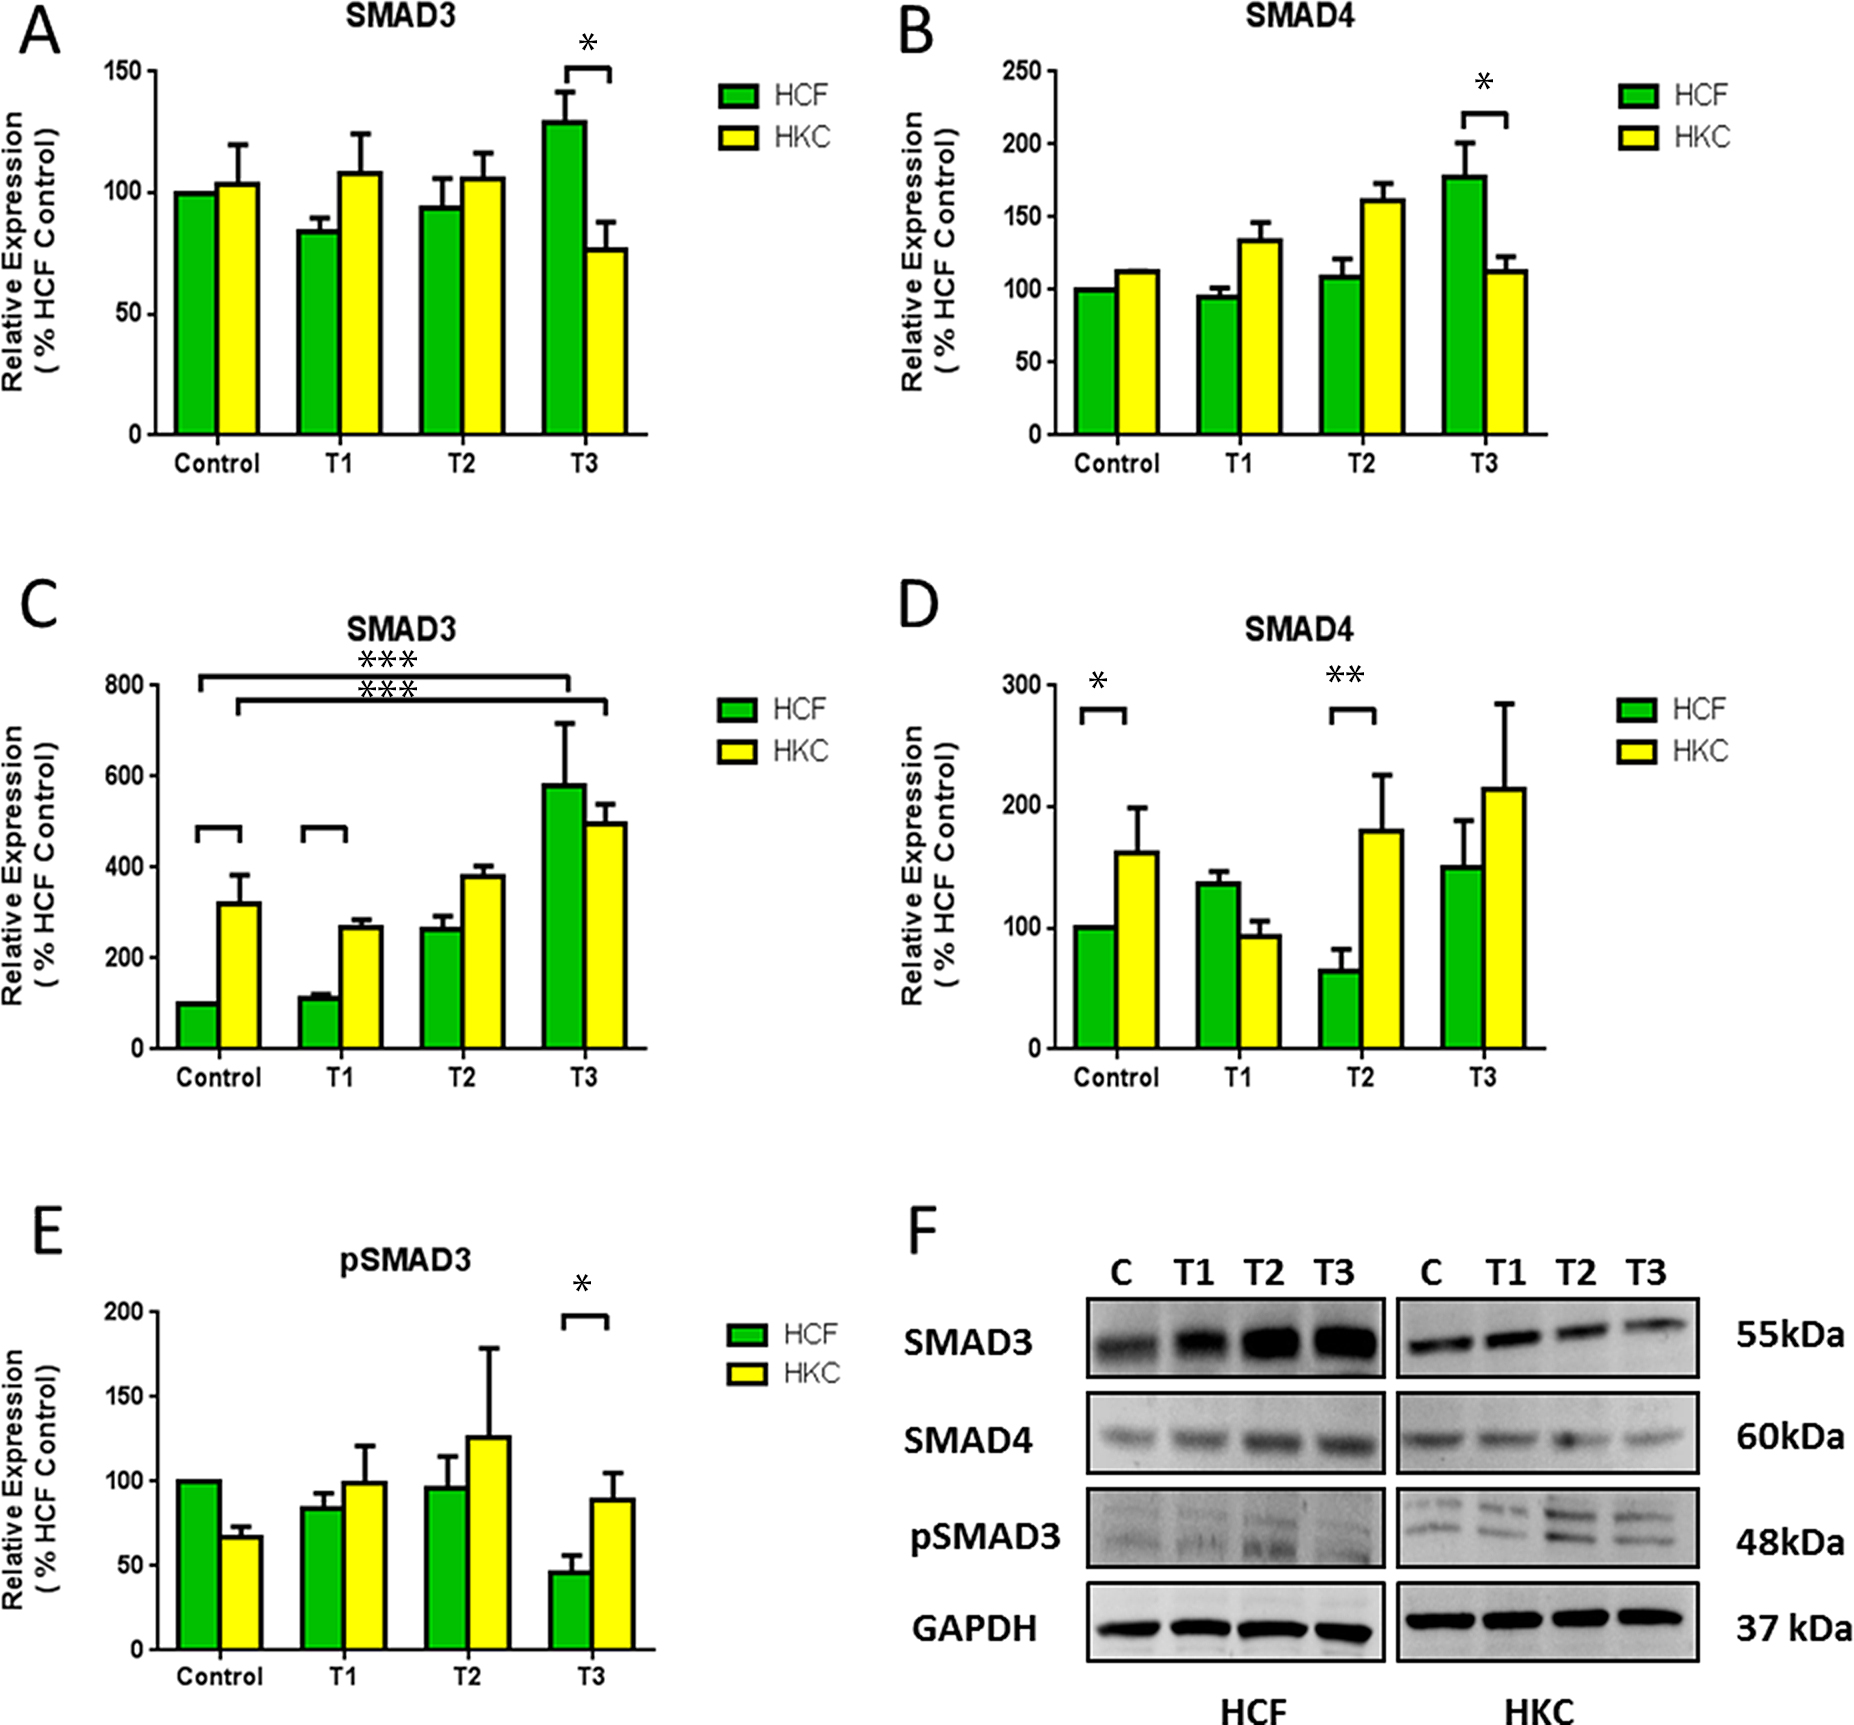
 Figure 4 of
Priyadarsini, Mol Vis 2015; 21:577-588.
Figure 4 of
Priyadarsini, Mol Vis 2015; 21:577-588.