Figure 3. Quantification of SMAD6 and SMAD7 expression in HCFs and HKCs following stimulation with all three TGF-β isoforms. RT-PCR
analysis shows gene expression for (A) SMAD6 and (B) SMAD7. Western blot analysis shows protein expression for (C) SMAD6 and (D) SMAD7. E: Representative Western blots from three independent experiments. All samples were repeated at least three times. p<0.05
was considered to be statistically significant (**p<0.01, *p<0.05).
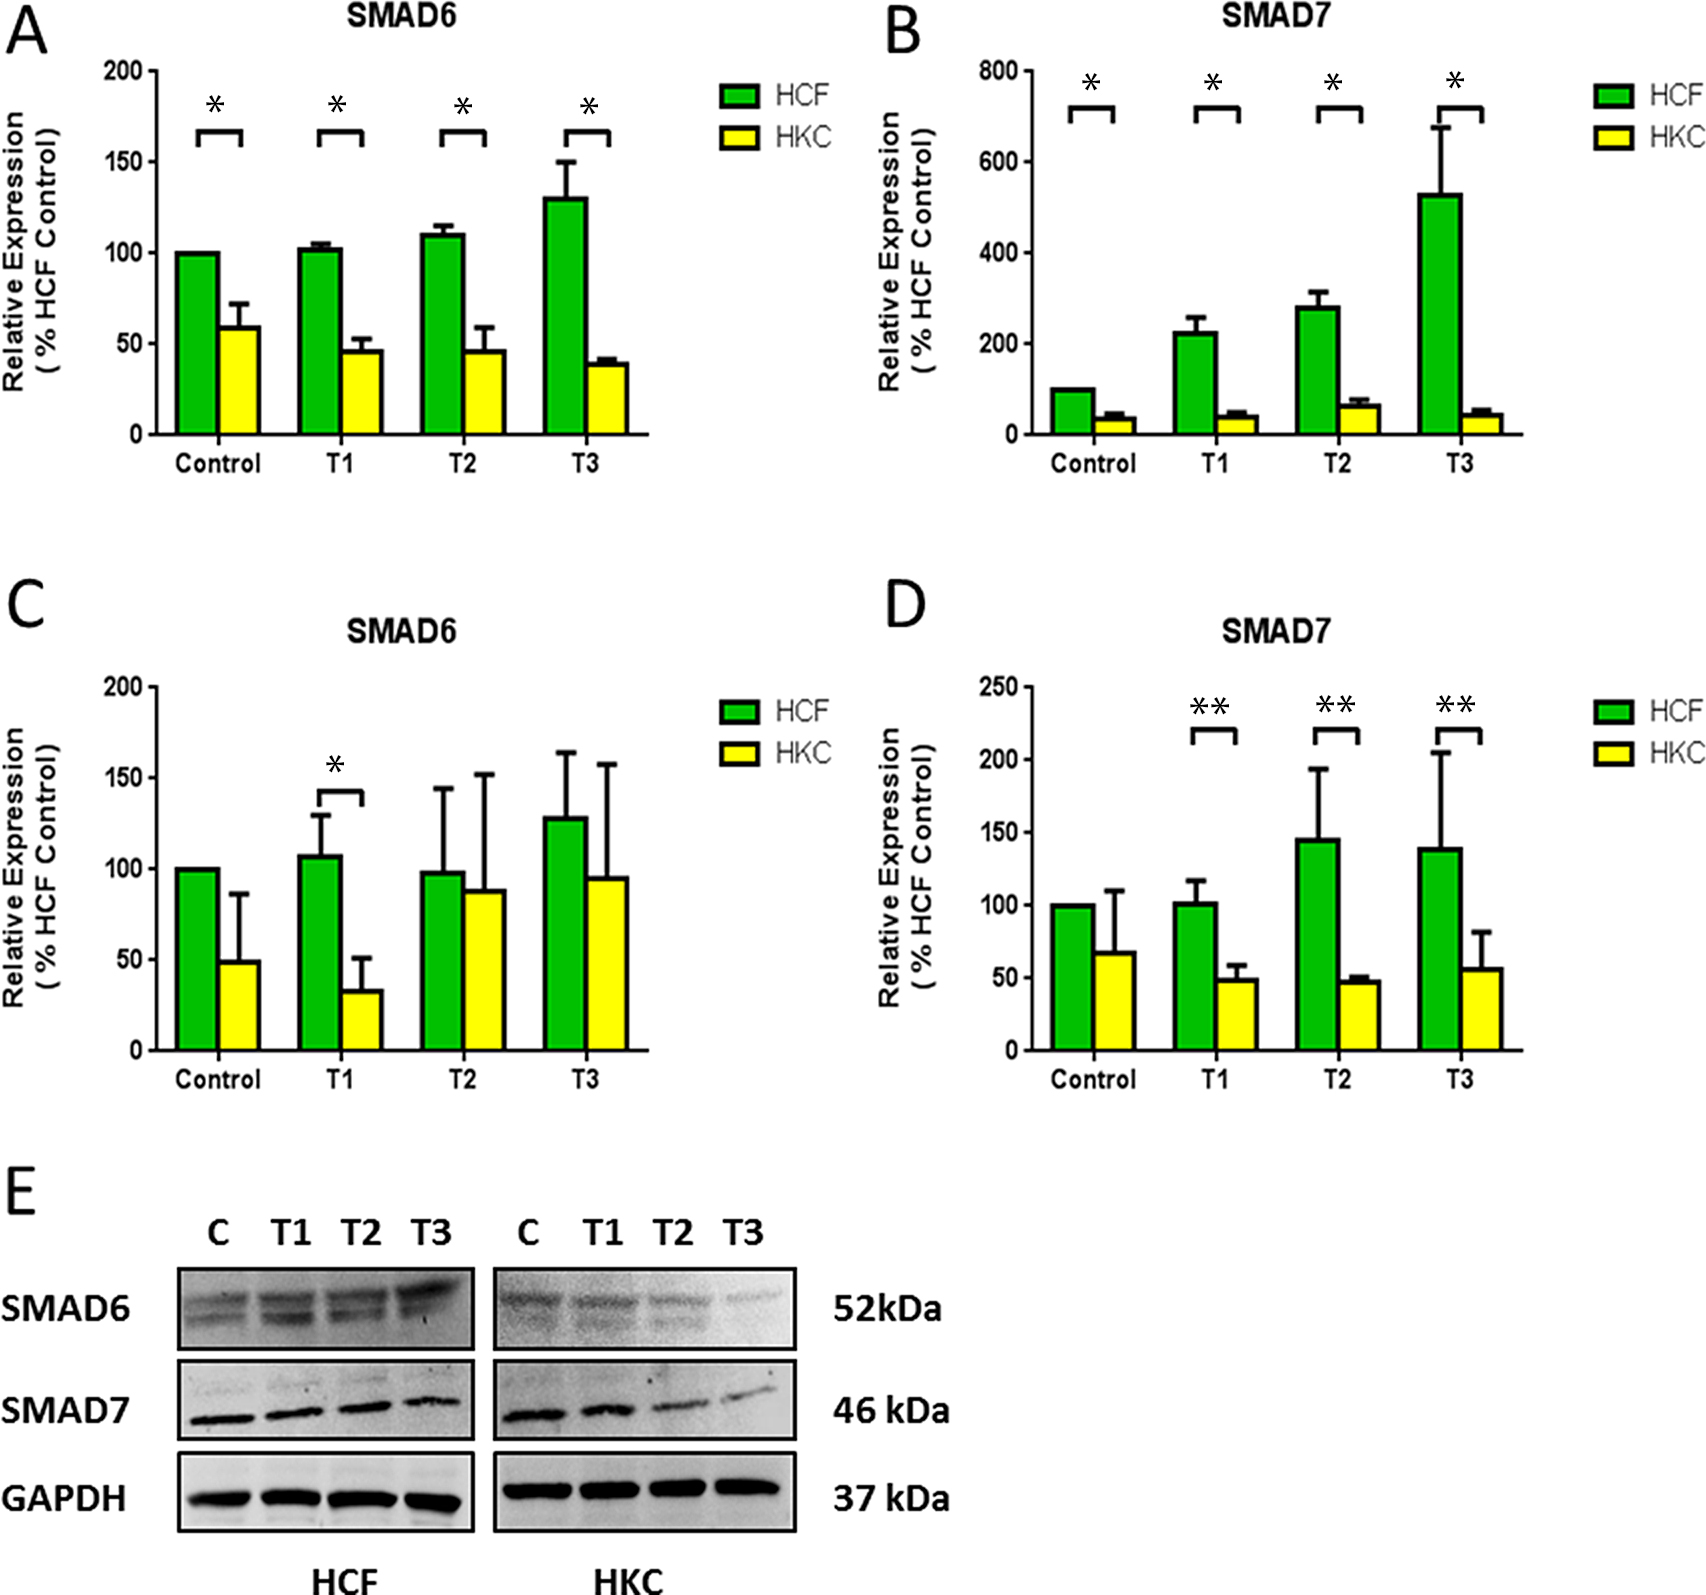
 Figure 3 of
Priyadarsini, Mol Vis 2015; 21:577-588.
Figure 3 of
Priyadarsini, Mol Vis 2015; 21:577-588.