Figure 4. Euler diagram of transcripts differentially expressed by TNFα and GSK0660. TNFα treatment resulted in the differential expression
of 1,830 transcripts compared to the vehicle. The addition of GSK0660 regulated 91 of these transcripts. In addition, co-treatment
of GSK0660 and TNFα resulted in the differential expression of 182 transcripts that were not affected by TNFα alone.
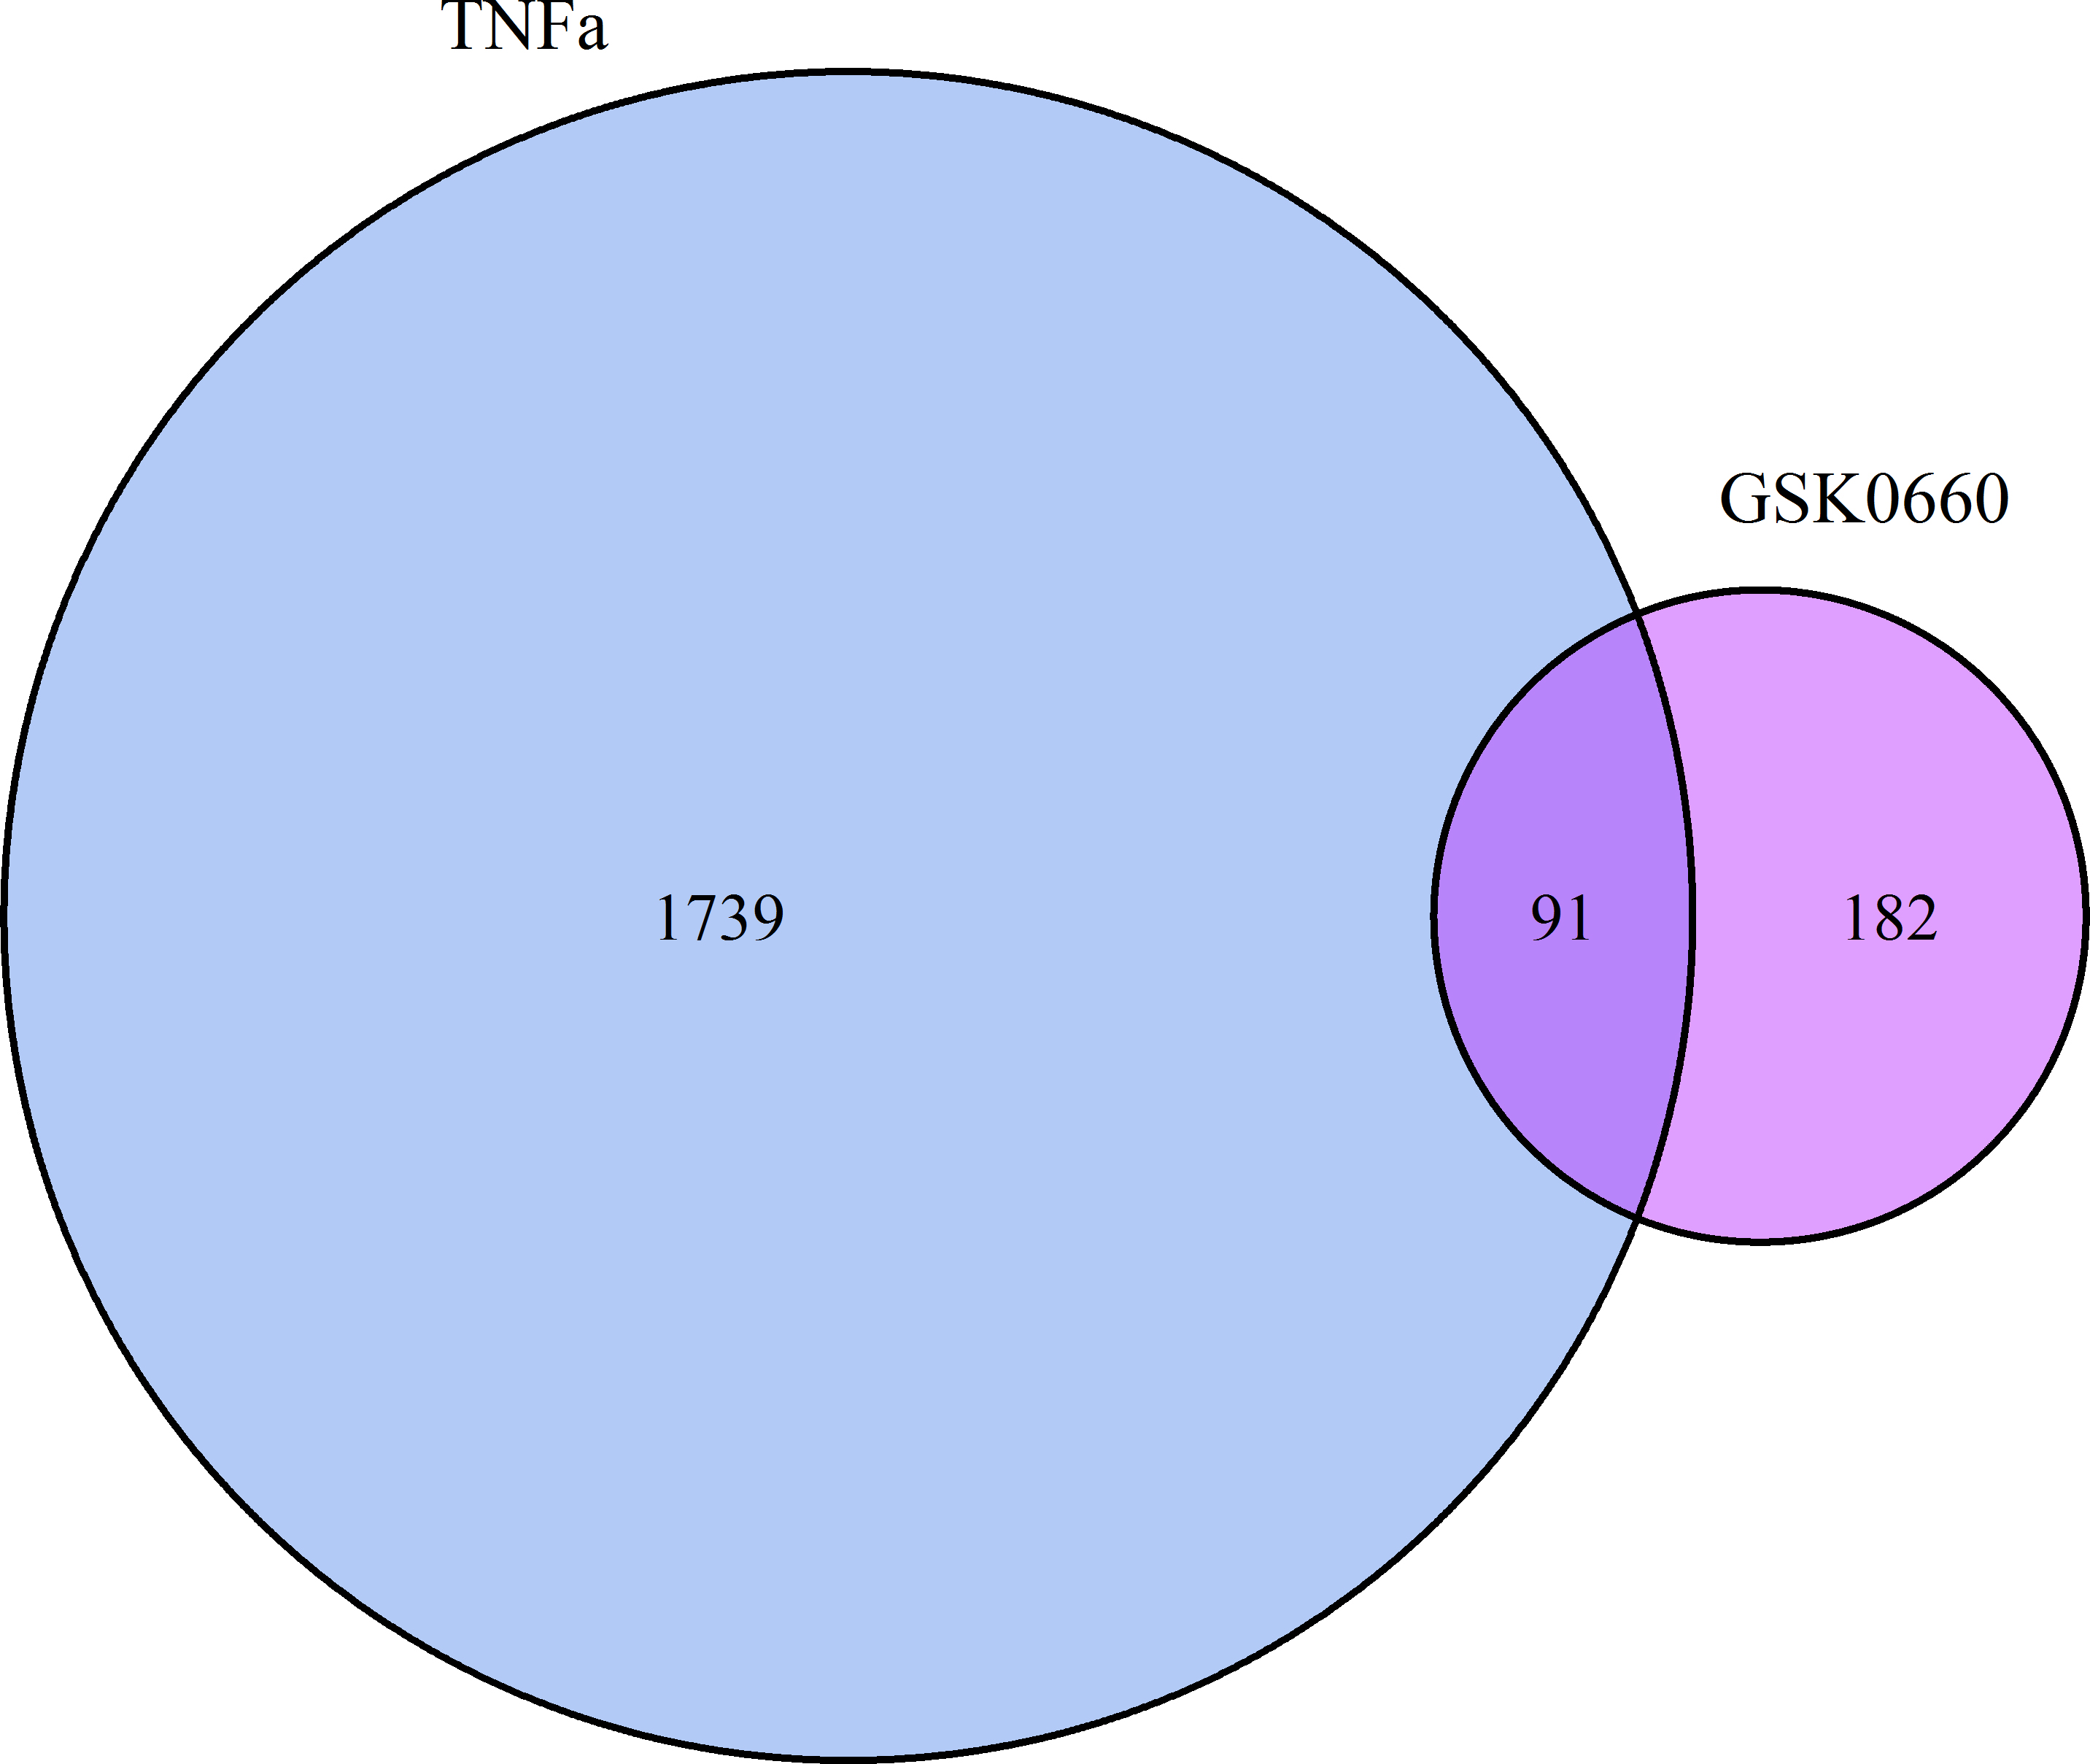
 Figure 4 of
Savage, Mol Vis 2015; 21:568-576.
Figure 4 of
Savage, Mol Vis 2015; 21:568-576.