Figure 6 of
Galbis-Estrada, Mol Vis 2015; 21:555-567.
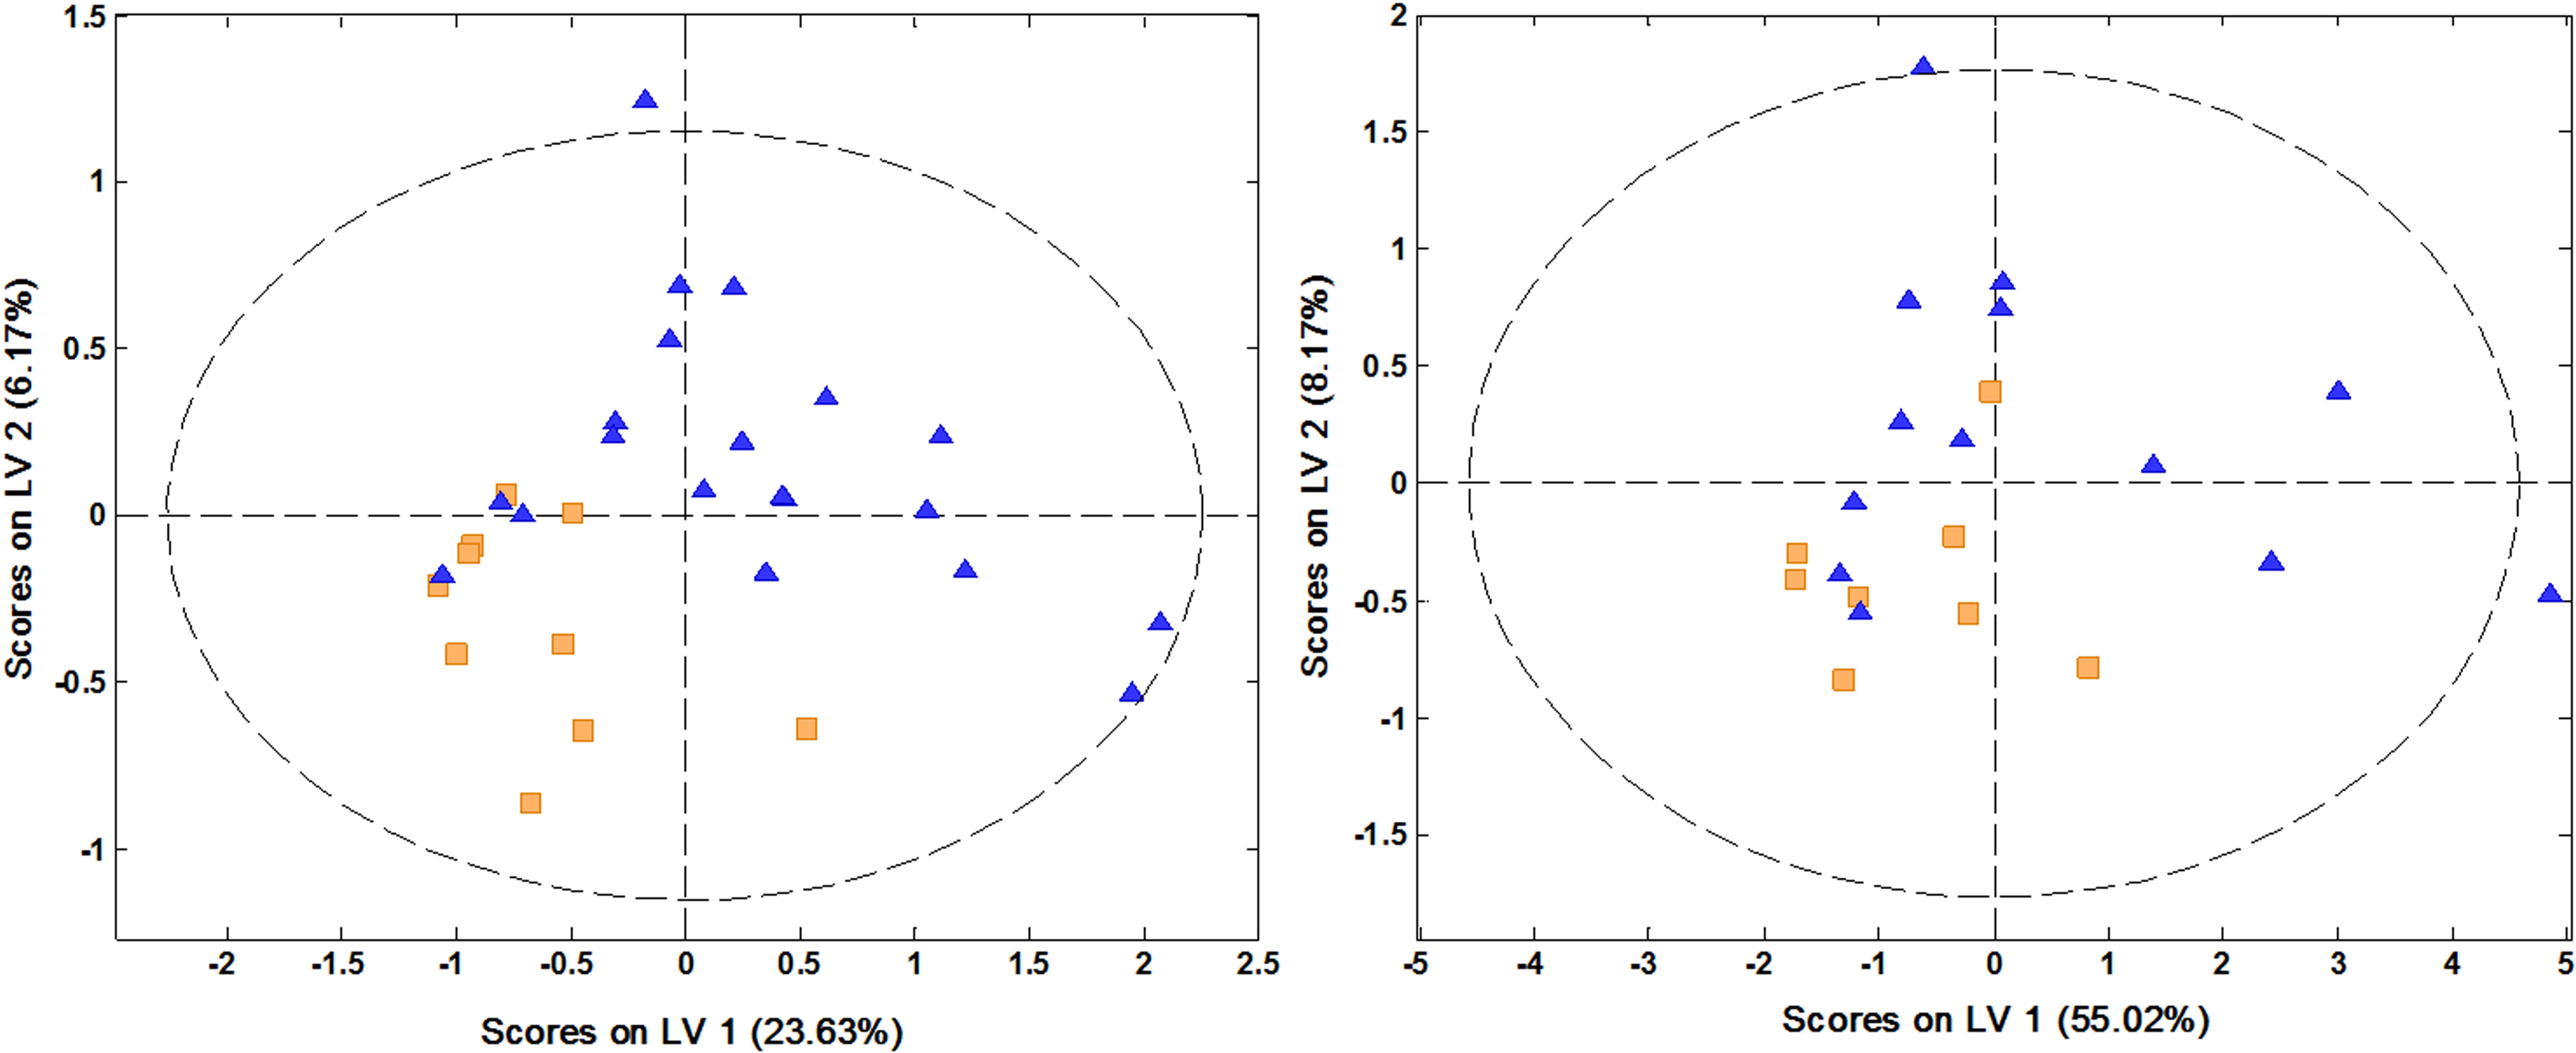
Figure 6.
Load diagram model of partial least-squares discriminate analysis differentiating between mild dry eyes (orange) and moderate dry eyes (blue) before supplementation (
A
) and after supplementation (
B
).
 Figure 6 of
Galbis-Estrada, Mol Vis 2015; 21:555-567.
Figure 6 of
Galbis-Estrada, Mol Vis 2015; 21:555-567.