Figure 5 of
Galbis-Estrada, Mol Vis 2015; 21:555-567.
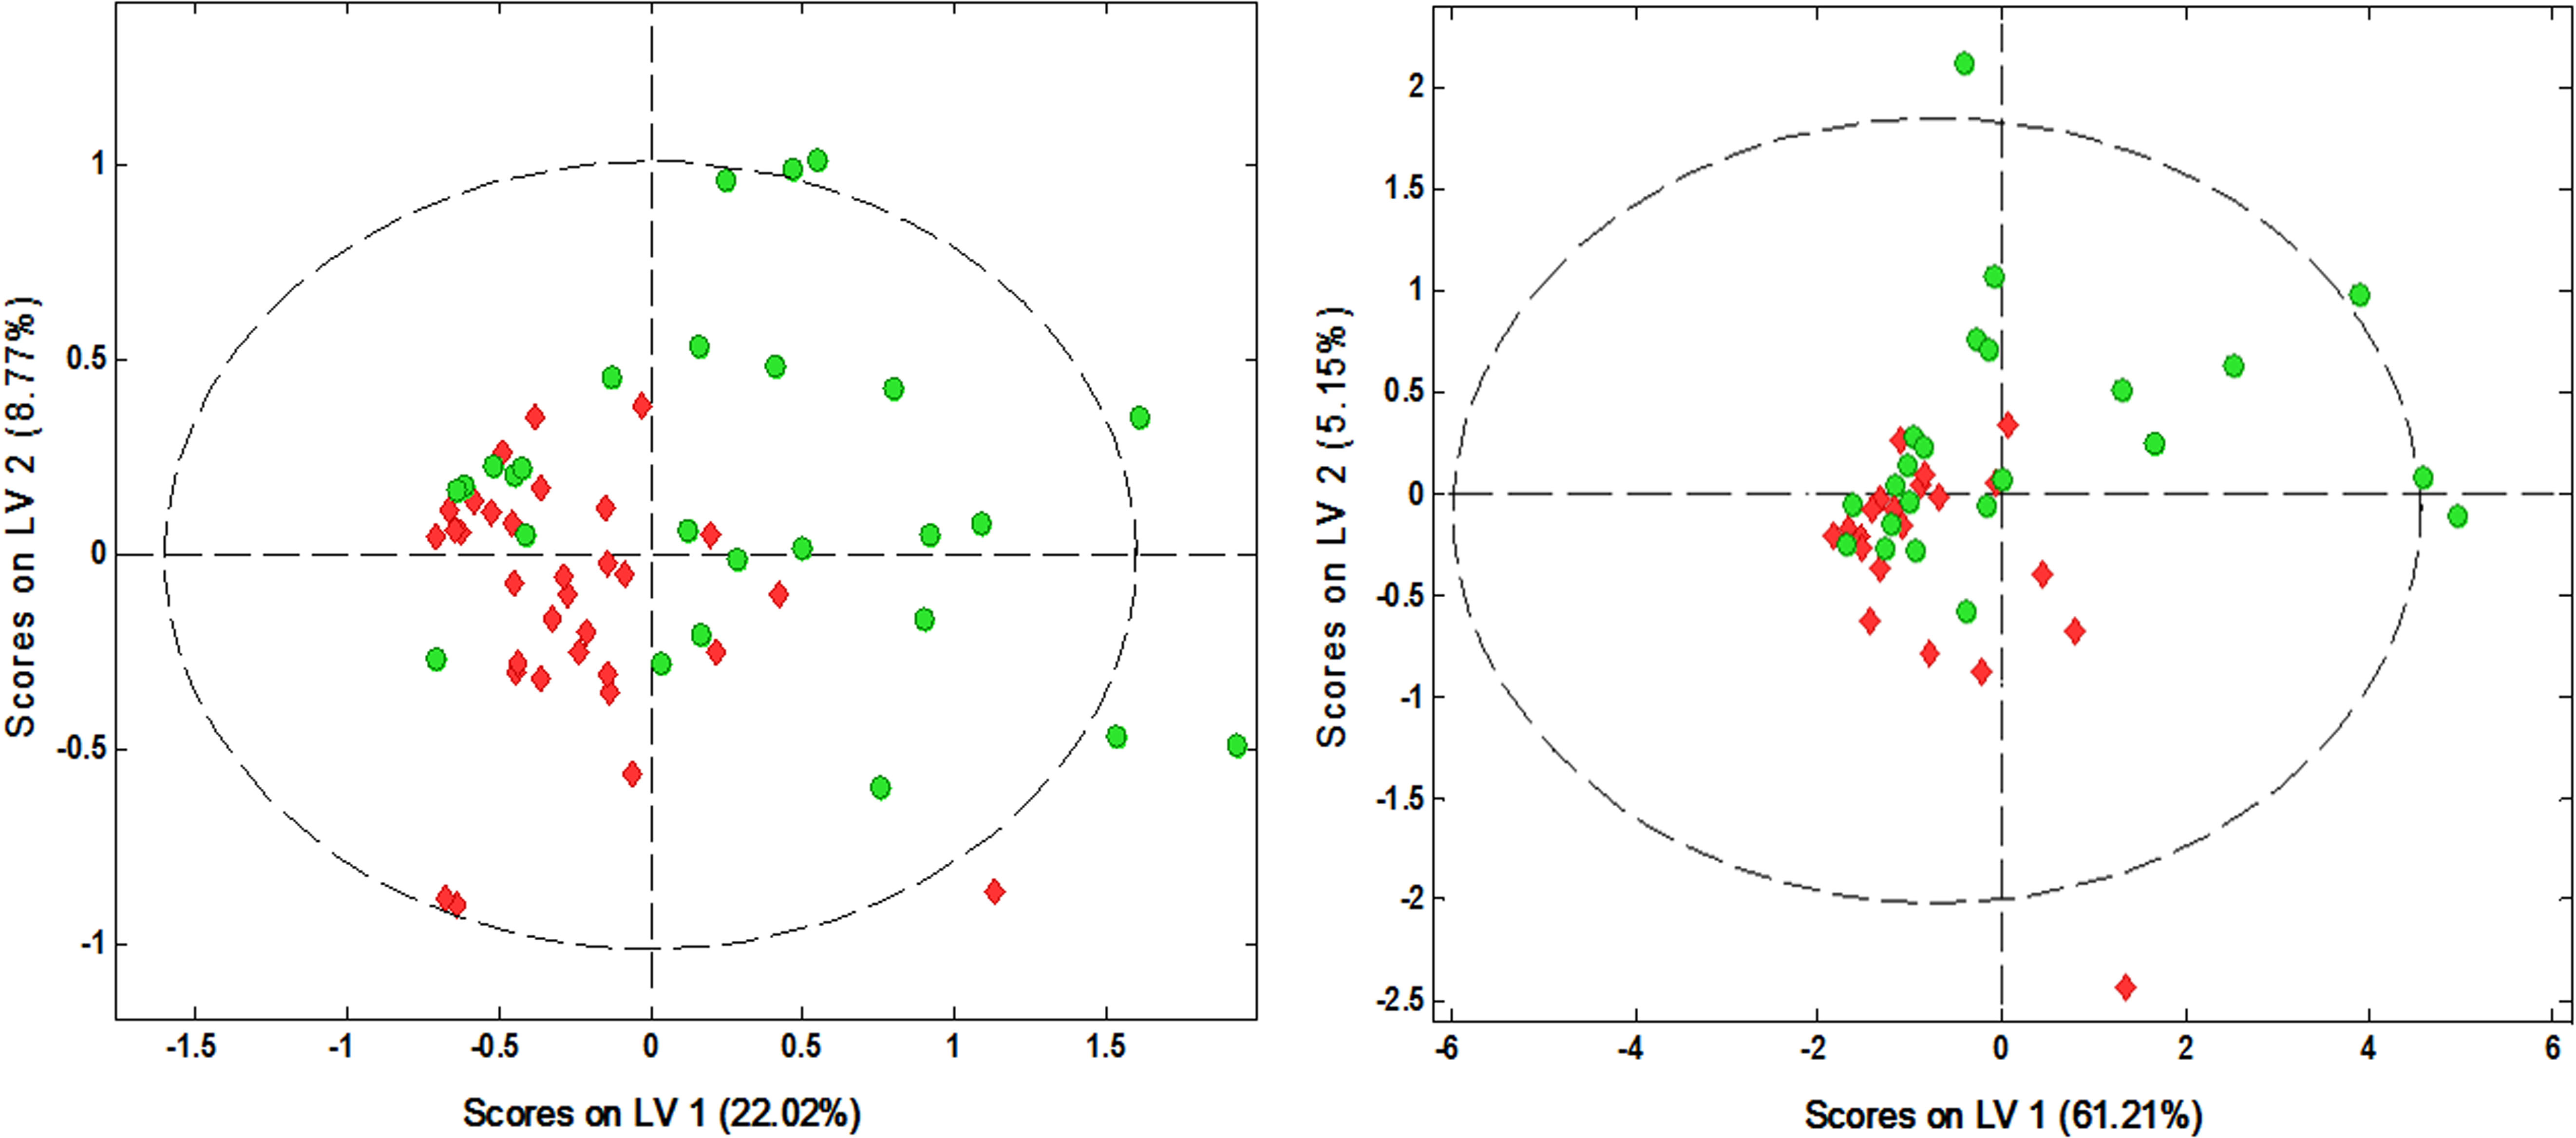
Figure 5.
Scores diagram of partial least-squares discriminate analysis of the dry eye syndrome group (green) and the control group (red) before supplementation (
A
) and after supplementation (
B
).
 Figure 5 of
Galbis-Estrada, Mol Vis 2015; 21:555-567.
Figure 5 of
Galbis-Estrada, Mol Vis 2015; 21:555-567.