Figure 3 of
Galbis-Estrada, Mol Vis 2015; 21:555-567.
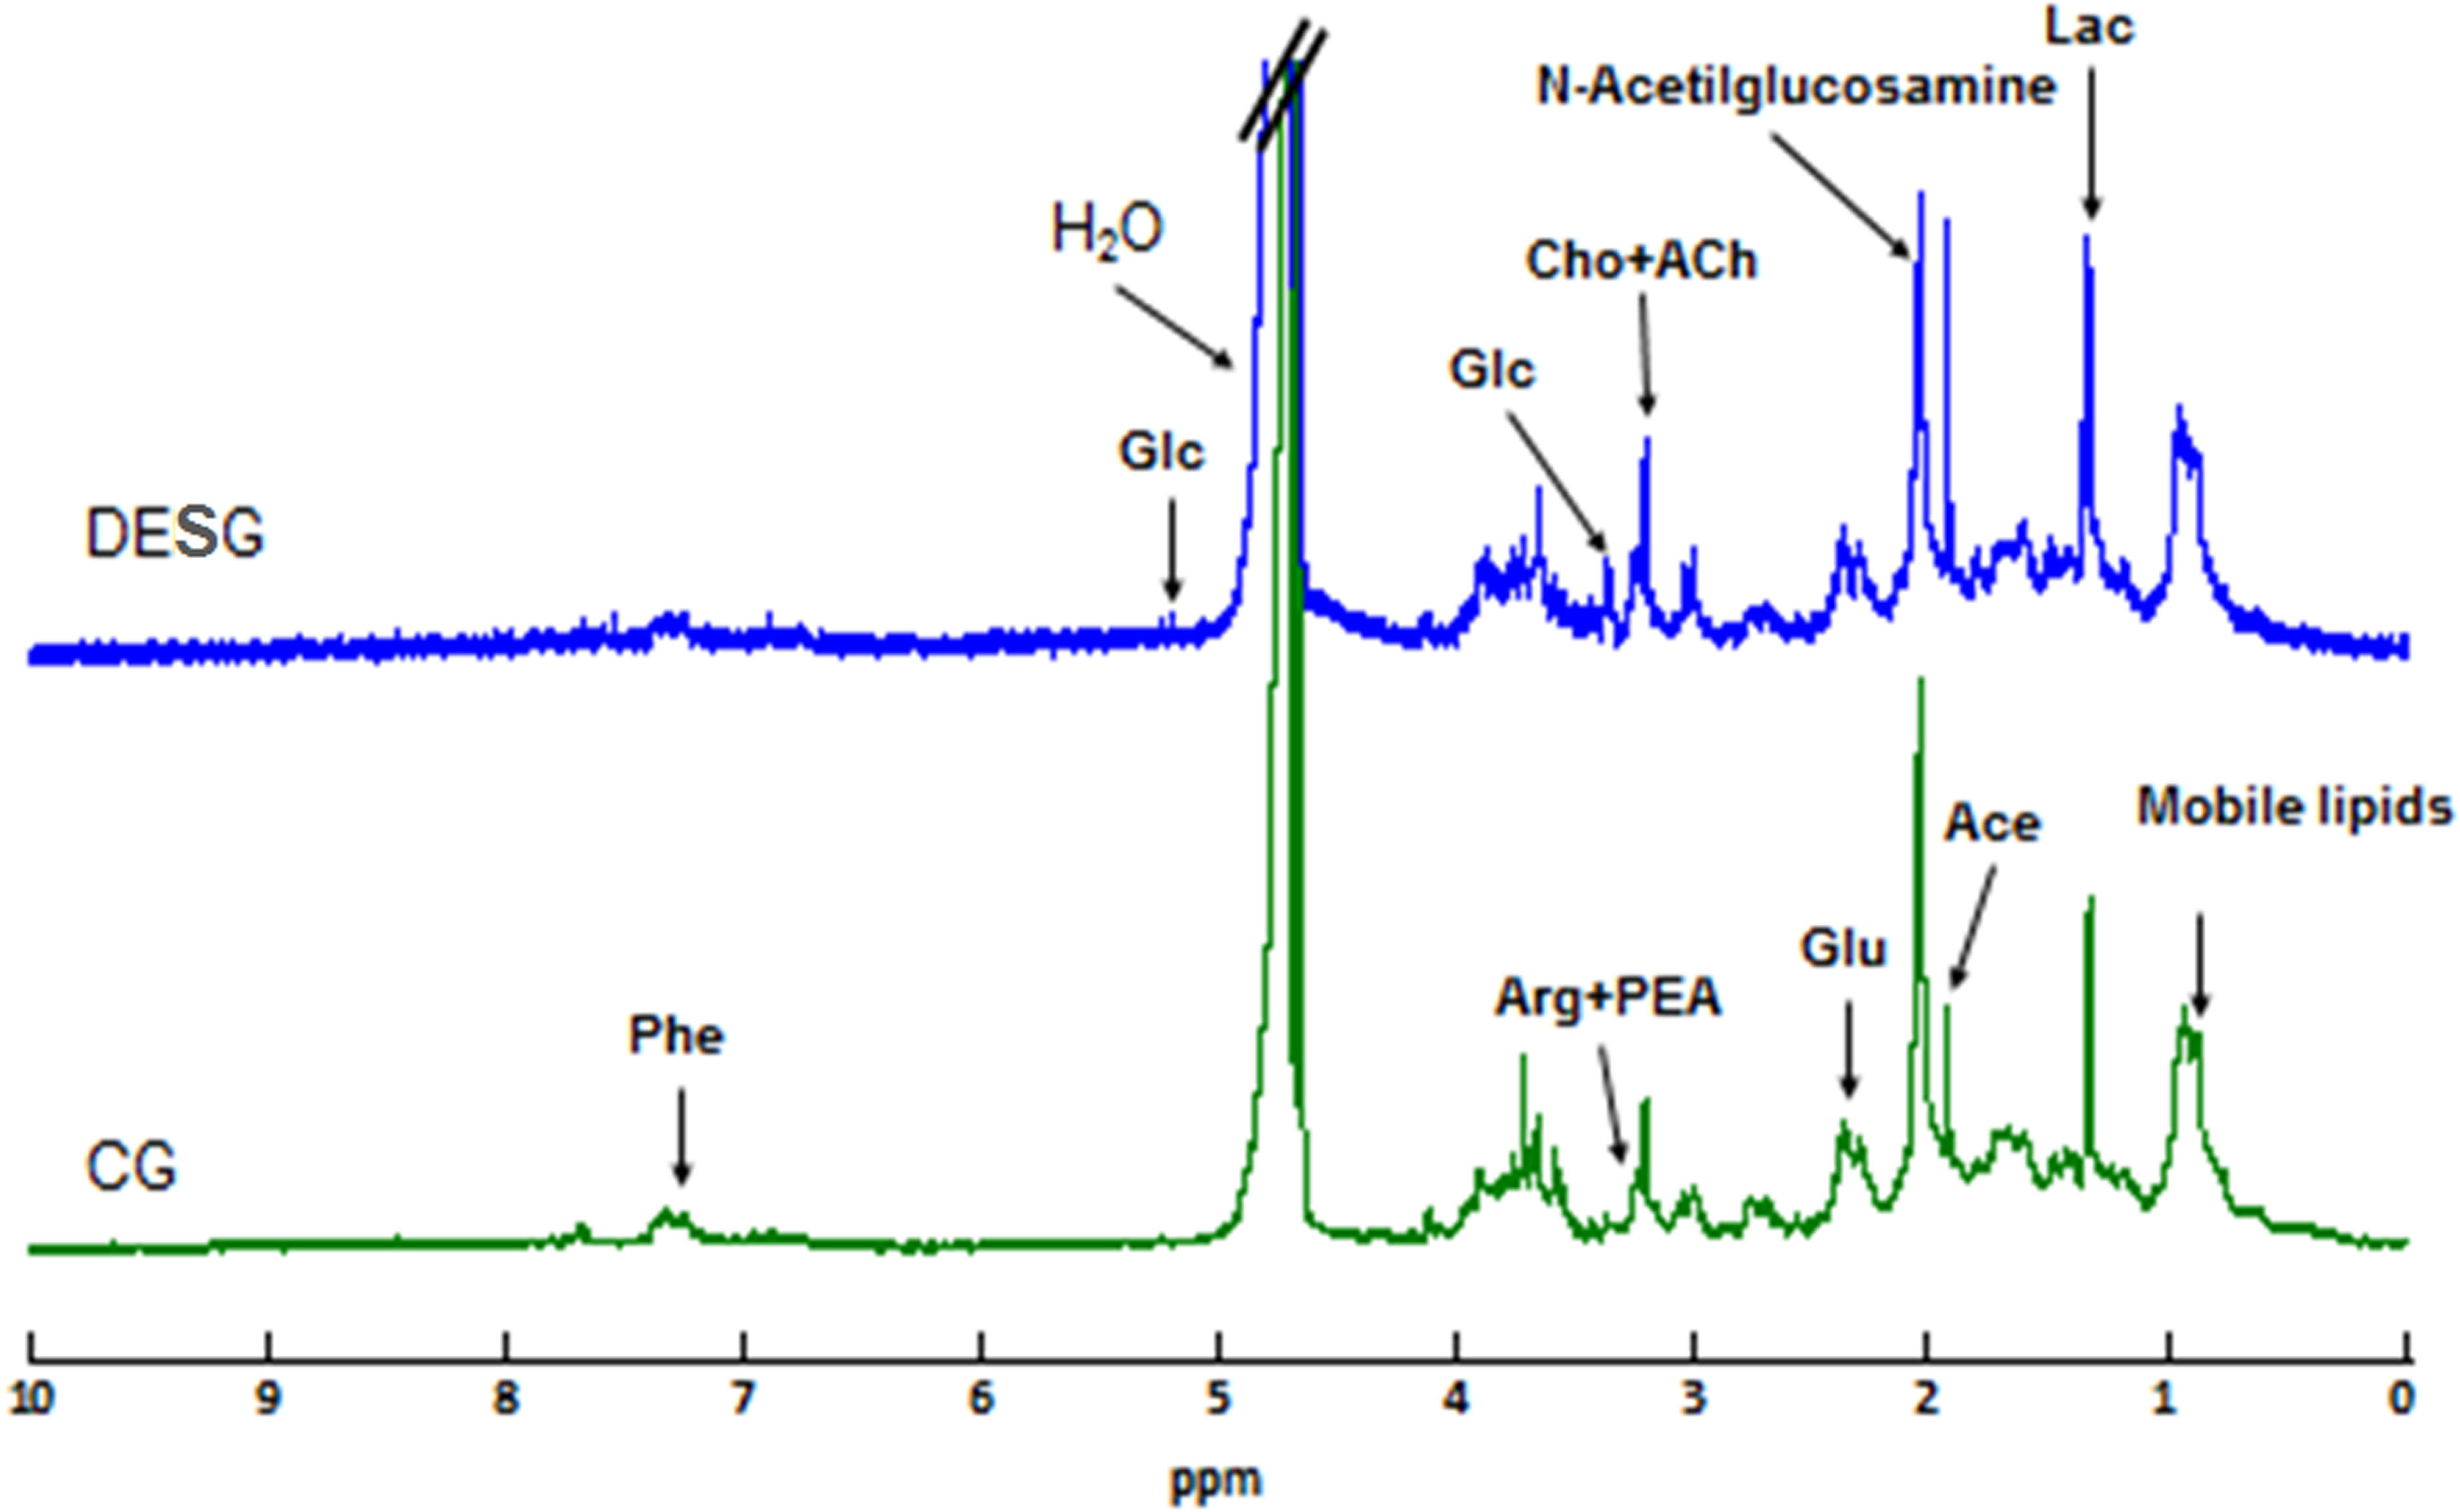
Figure 3.
Average spectrum representation of the dry eye syndrome group tears compared to that of the control group before treatment.
 Figure 3 of
Galbis-Estrada, Mol Vis 2015; 21:555-567. Figure 3 of
Galbis-Estrada, Mol Vis 2015; 21:555-567.
Figure 3 of
Galbis-Estrada, Mol Vis 2015; 21:555-567. Figure 3 of
Galbis-Estrada, Mol Vis 2015; 21:555-567.