Figure 3. Comparison of the outer regions of the retina. A: Without a fluorescent nuclear dye (ethidium bromide homodimer; EthD-1) counterstain. B: With nuclear fluorescent dye. Panels A and B show the outer retina imaged with third harmonic generation (THG) and two-photon autofluorescence (TPAF). In the RPE layer,
the EthD-1 staining (Panel B, x) coincides with the THG signal from the RPE cell nuclei (Panel A, *). In the outer nuclear layer (ONL), no THG signal is apparent in Panel A in the cell nuclei labeled with nuclear dye (Panel B, +). Here, the THG signal labels the ONL cell membrane. Panel C shows an adjacent histological section stained with hematoxylin and eosin. Scale bar=20 µm.
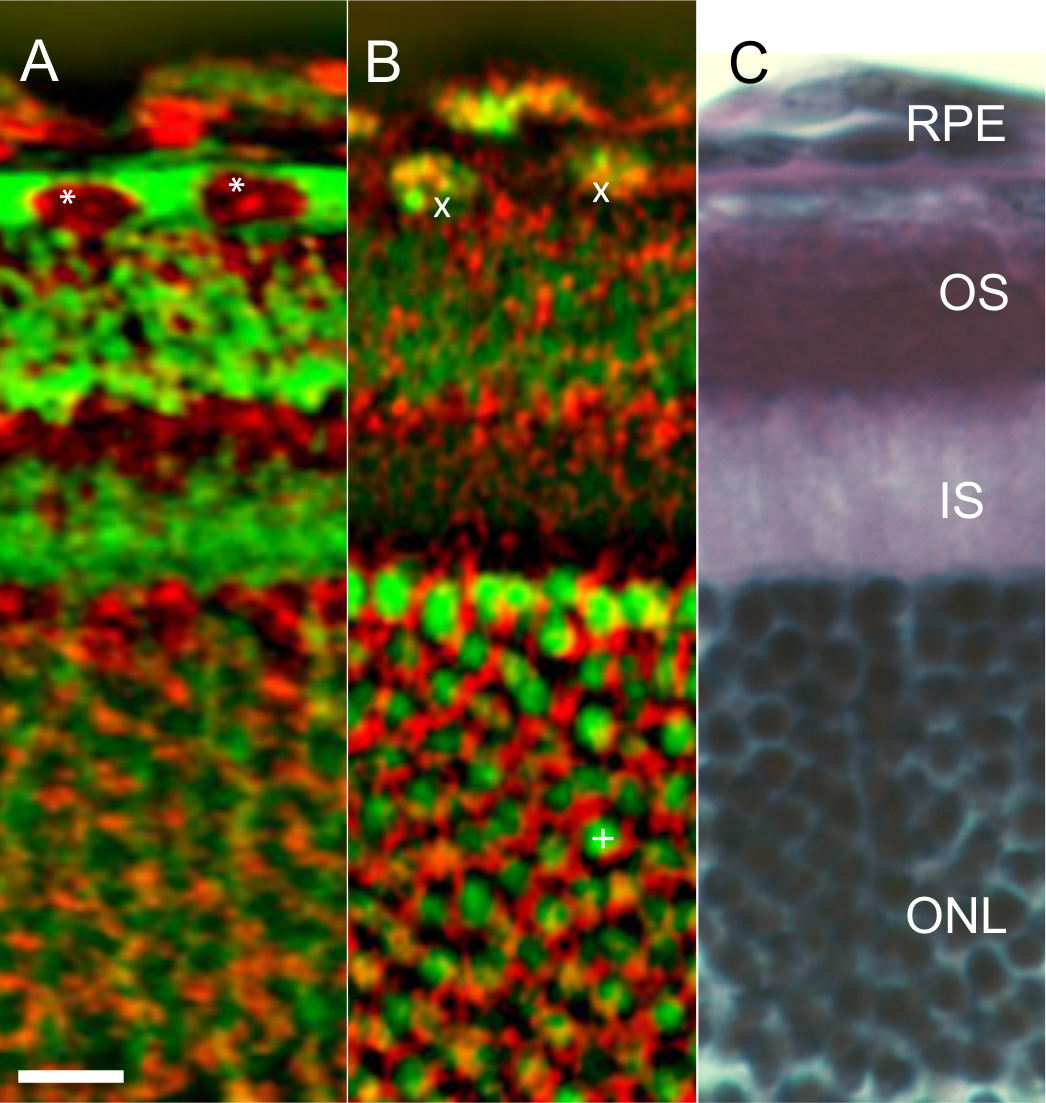
 Figure 3 of
Masihzadeh, Mol Vis 2015; 21:538-547.
Figure 3 of
Masihzadeh, Mol Vis 2015; 21:538-547.