Figure 3. Histology validates OCT findings. Examples of a 12-week and two 20-week T-antigen retinoblastoma (TAg-RB) eyes analyzed with
funduscopy (A, E, I); optical coherence tomography (OCT) (B, F, J), OCT scale bars=100 µm; high-magnification hematoxylin and eosin (H&E; C, G, K); and low-magnification H&E (D, H, L), scale bars=200 µm. The lens is indicated with an asterisk (*).
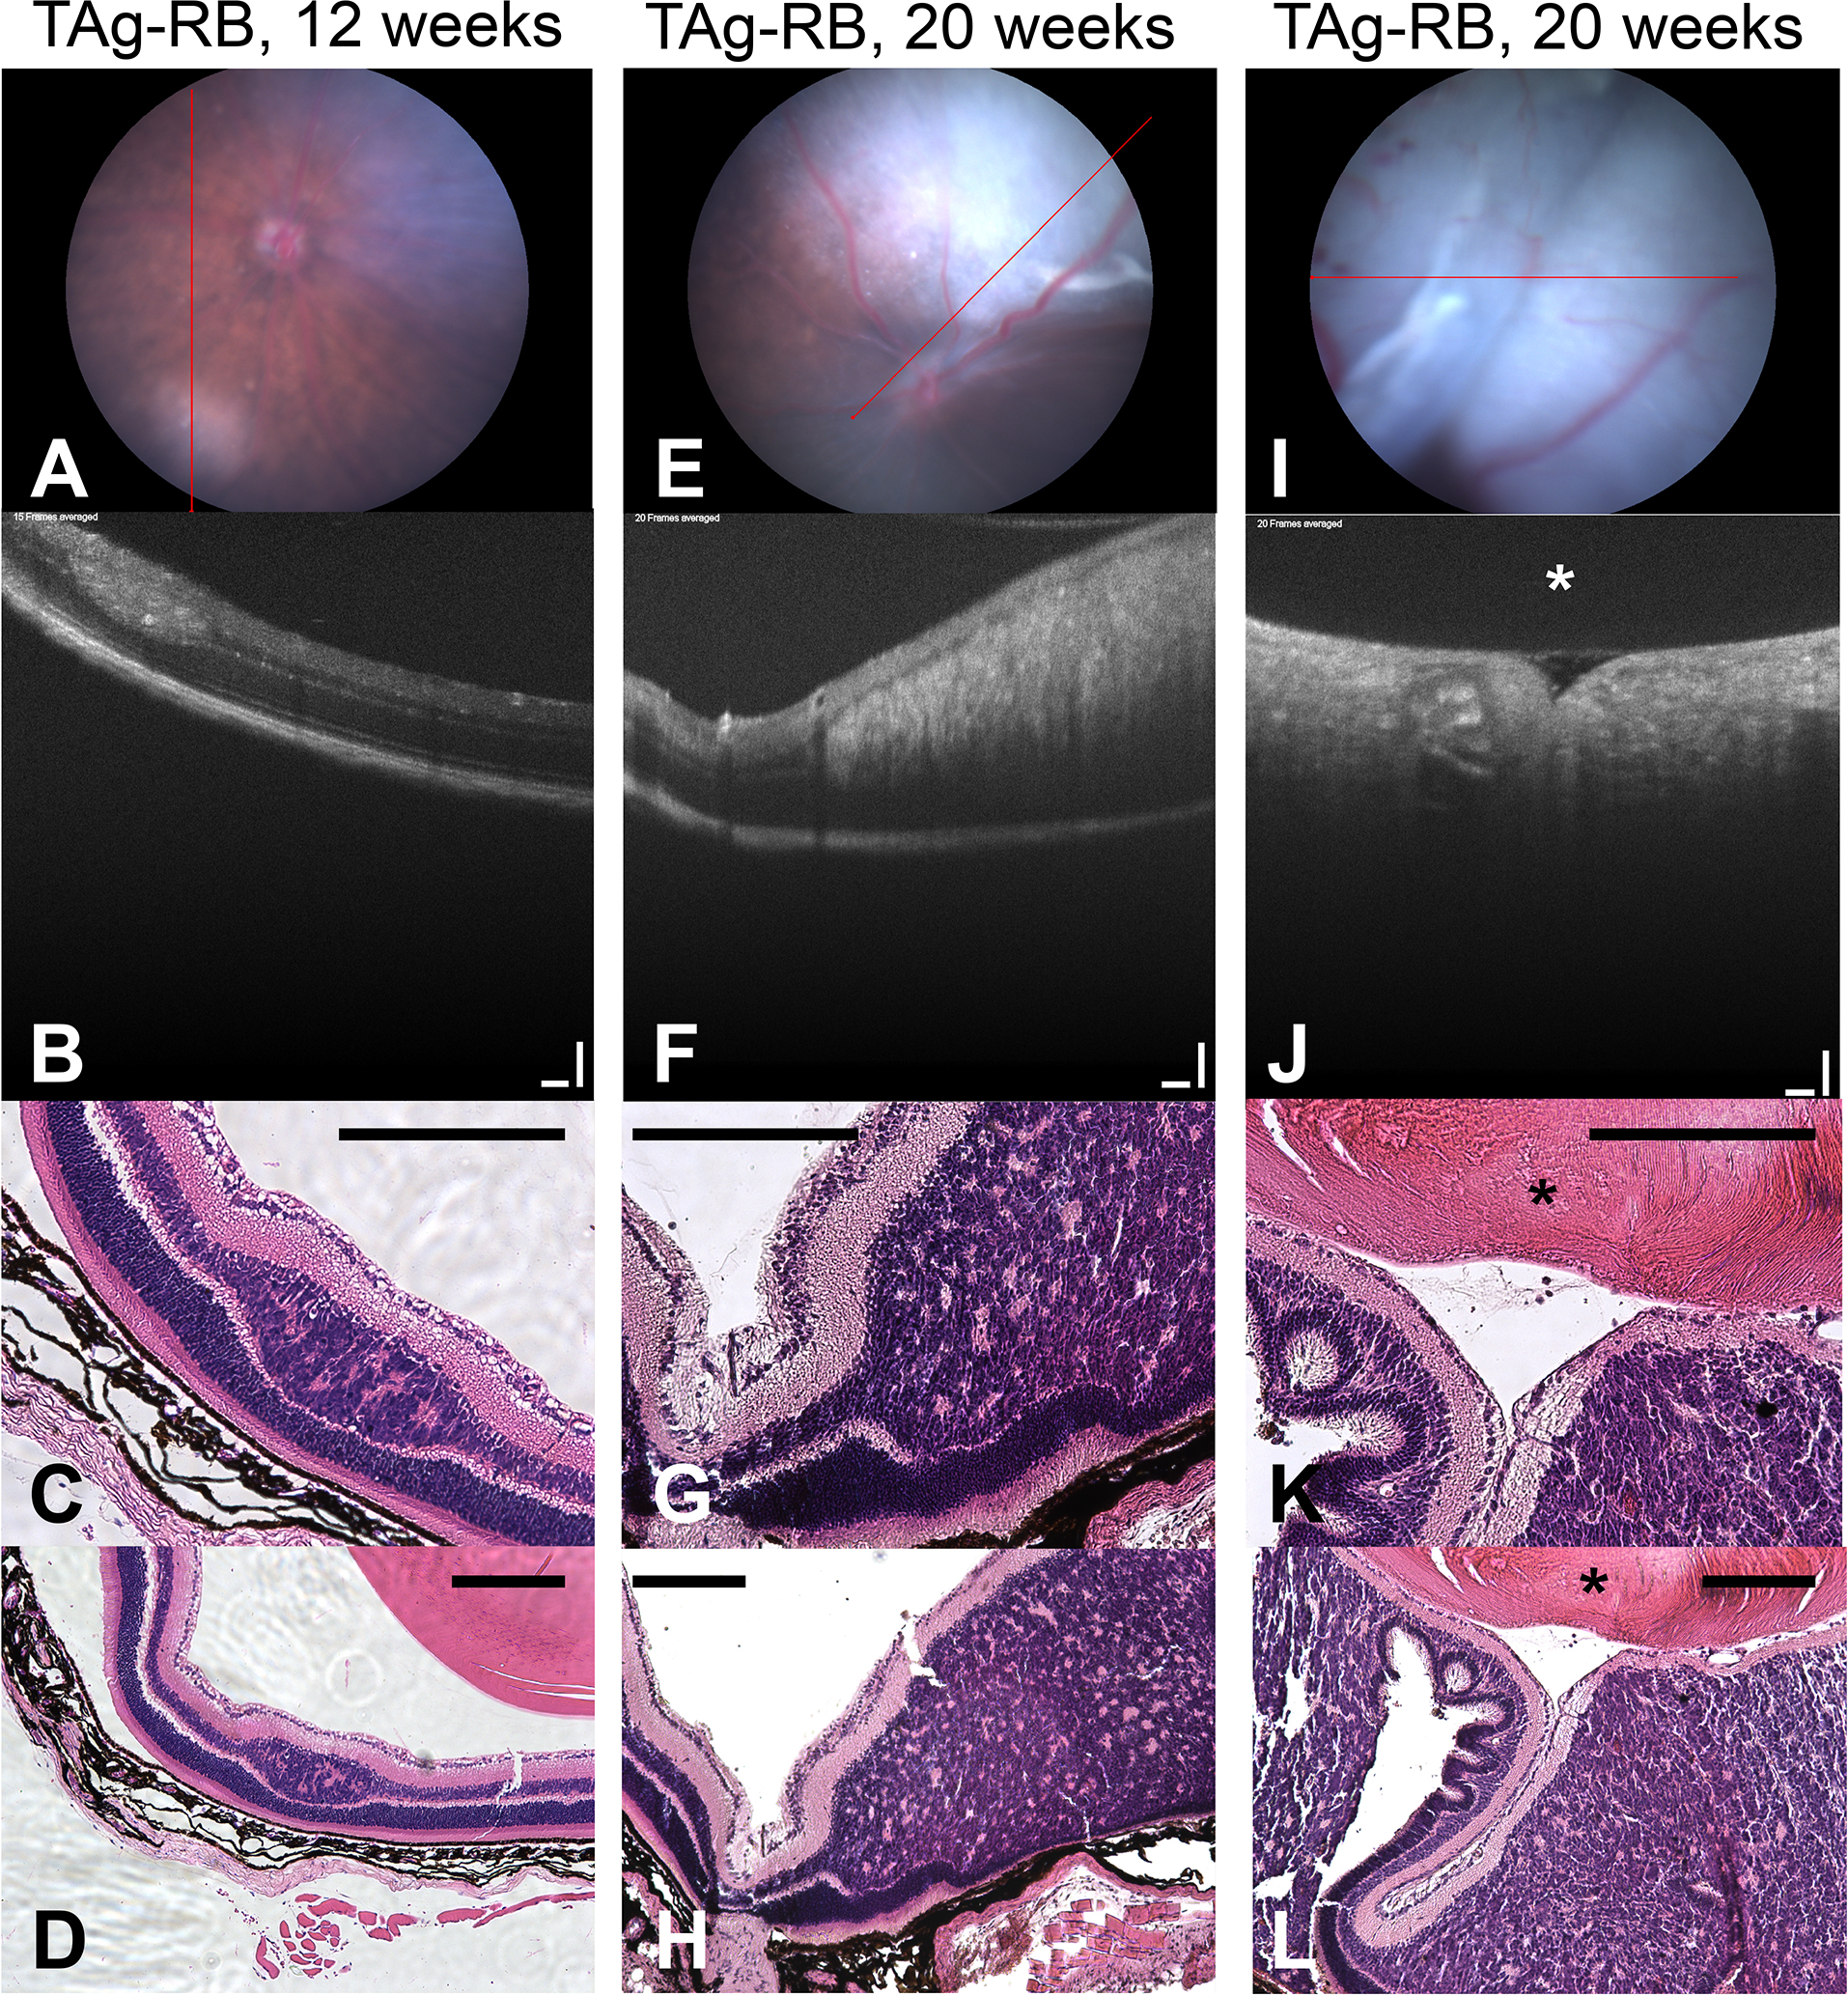
 Figure 3 of
Wenzel, Mol Vis 2015; 21:515-522.
Figure 3 of
Wenzel, Mol Vis 2015; 21:515-522.