Figure 2. Effect of TSA on TGFβ-induced myofibroblast transformation. A: In hydrated 3-D collagen matrices, approximately 20% of cells show positive labeling for α-SM-actin localized to the stress
fibers following 4 days of treatment with TGFβ1. Green: f-actin; red: α-SM-actin; cyan: collagen. B: Labeling for α-SM-actin was not observed following treatment with TSA. Green: f-actin; red: α-SM-actin. C: TGFβ1-treated cells also show enhanced vinculin labeling of focal contacts at the ends of stress fibers, which was inhibited
by TSA (D). Green: f-actin; red: vinculin. E: western blot analysis from cell extracts showing the expression of α-SM actin after treatment with TGFβ1, TGFβ1 + TSA, or
TGFβ1 + SAHA. TSA and SAHA both inhibited the expression of α-SM actin. The result is representative of two independent experiments.
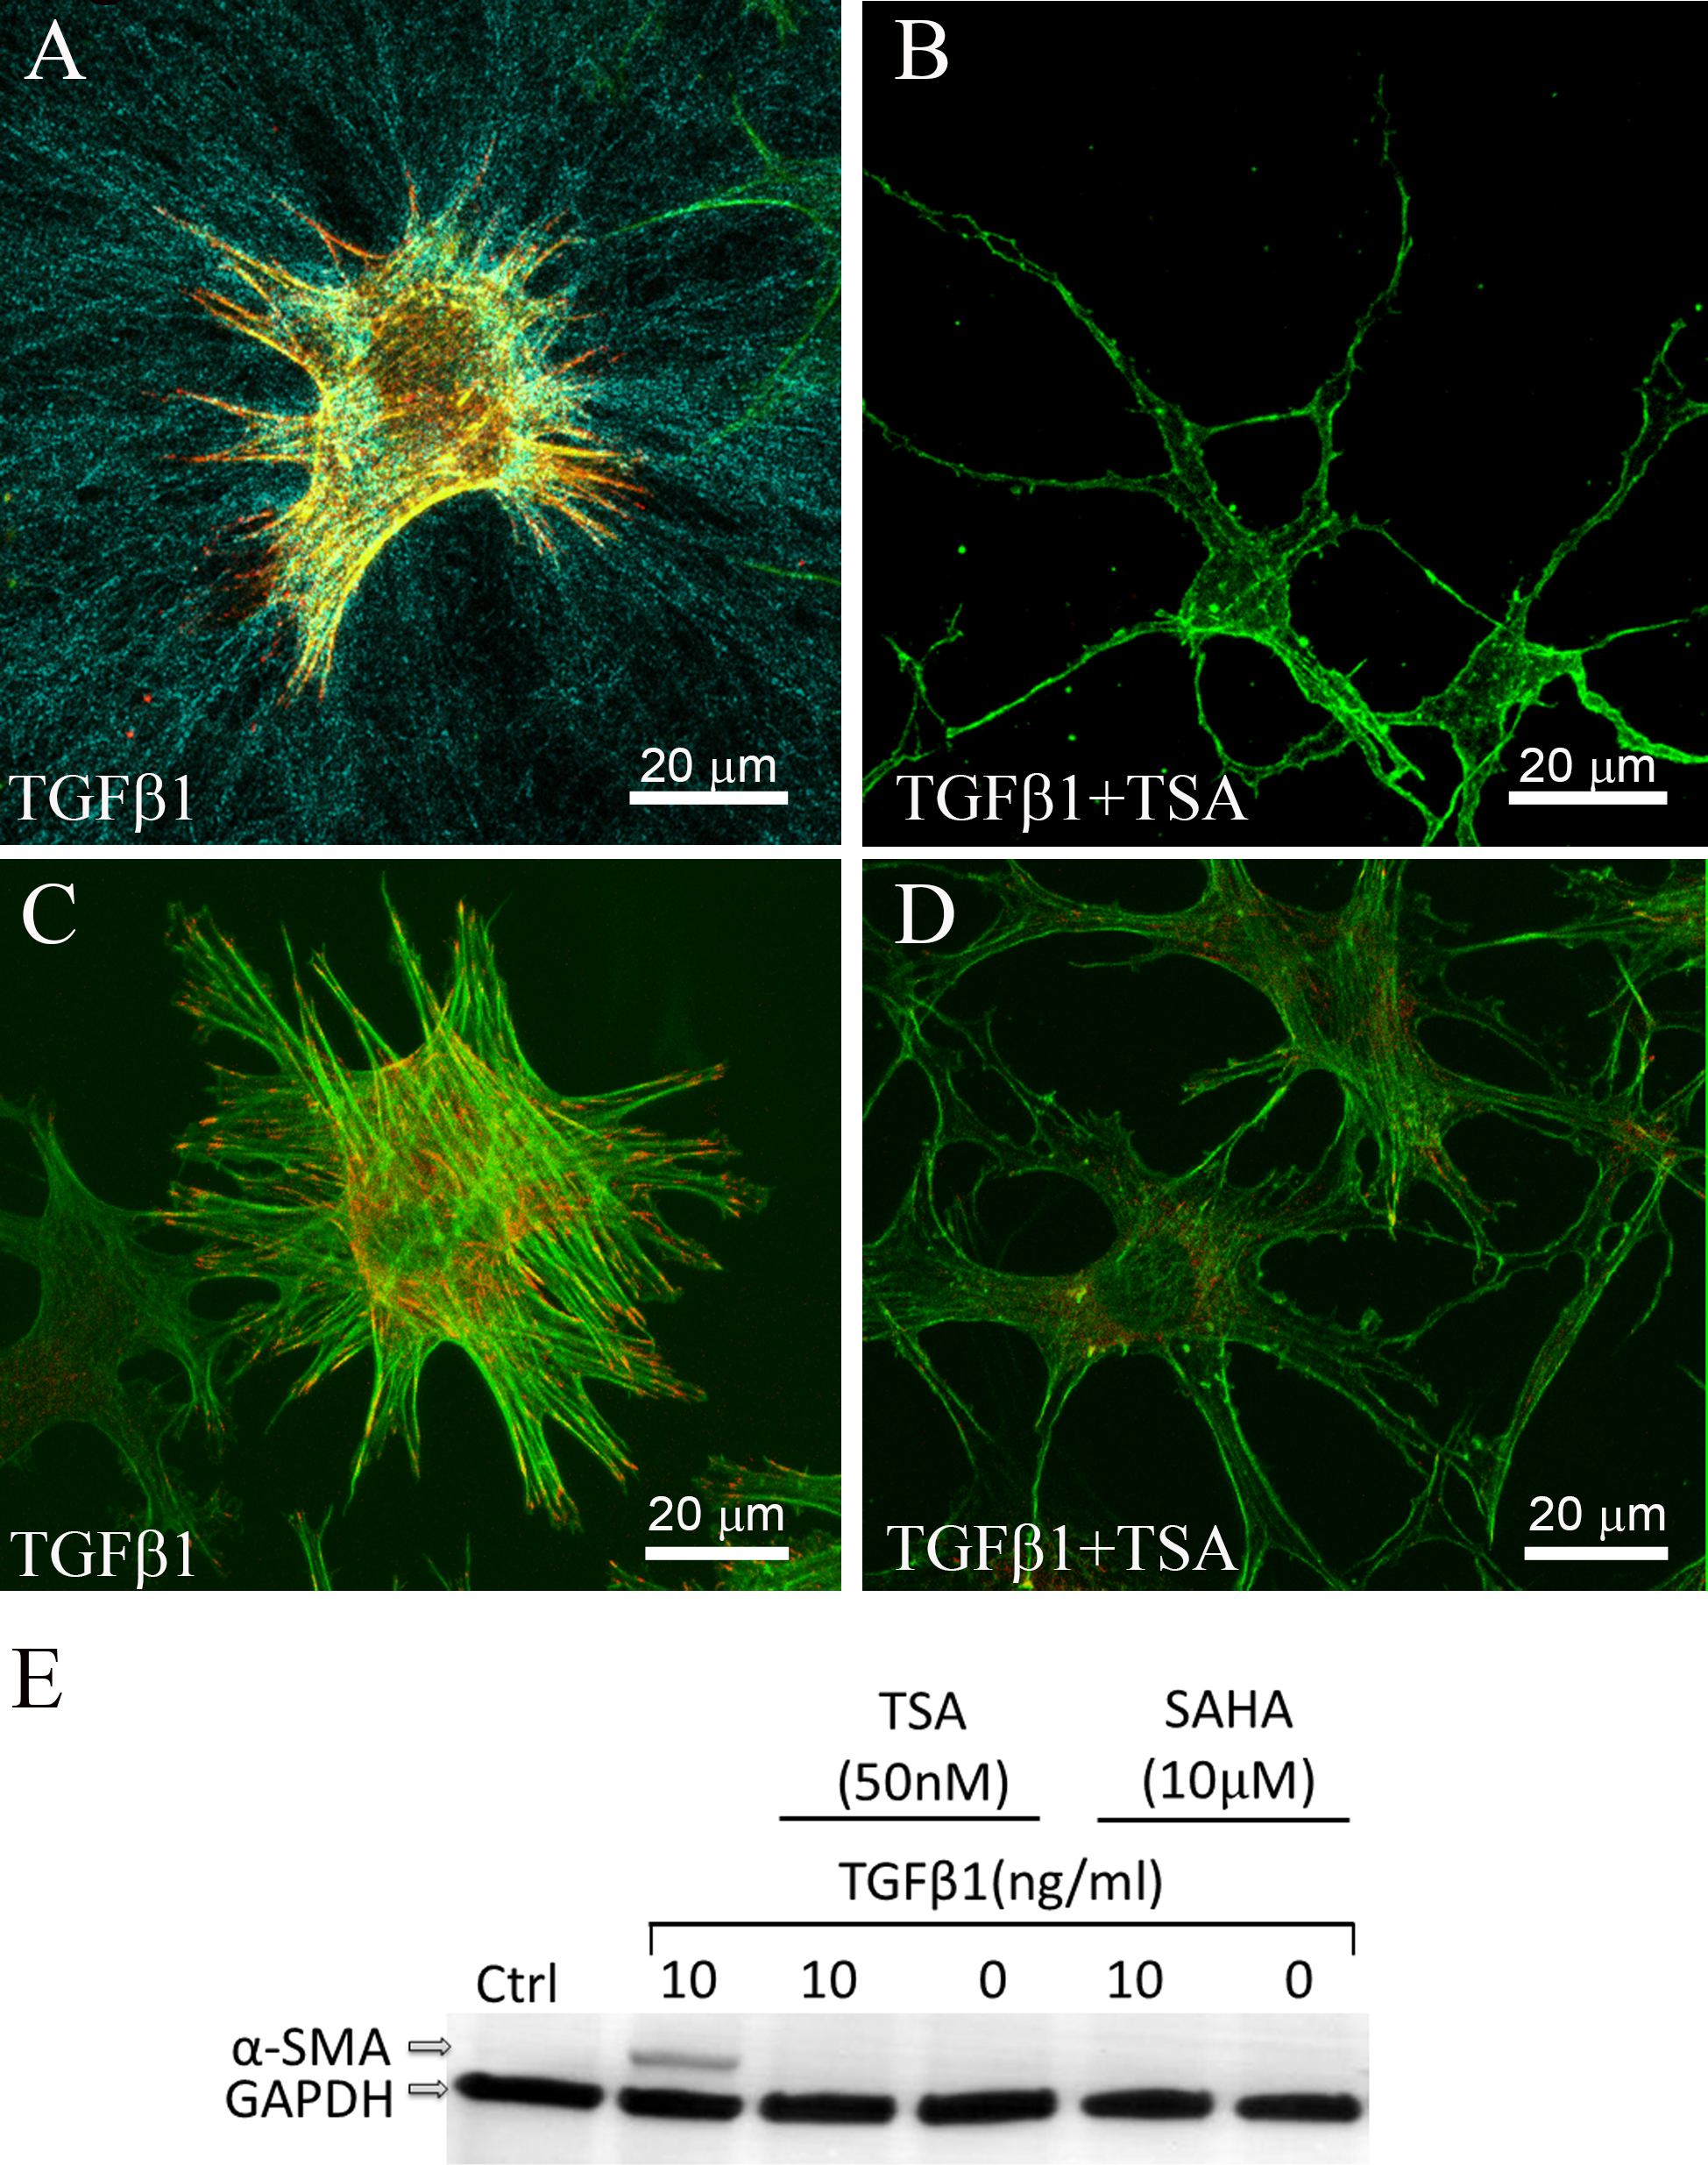
 Figure 2 of
Koppaka, Mol Vis 2015; 21:502-514.
Figure 2 of
Koppaka, Mol Vis 2015; 21:502-514.