Figure 4. Functional interaction network obtained using the FI Cytoscape plugin, which allowed construction of FI sub-networks (modules)
based on protein–protein interactions and gene coexpression. The proteins were clustered into six modules numbered from 0
to 5, composed of 11, 9, 8, 5, 4, and 4 proteins. Proteins showing deregulation in our study are represented by circles, whereas
newly added proteins or interconnectors are represented by diamonds. FIs extracted from pathways are shown as solid lines,
while those predicted using NBC are shown as dashed lines. Extracted FIs involved in activation, expression regulation, or
catalysis are shown with an arrowhead on the end of the line, and FIs involved in inhibition are shown with a “T” bar.
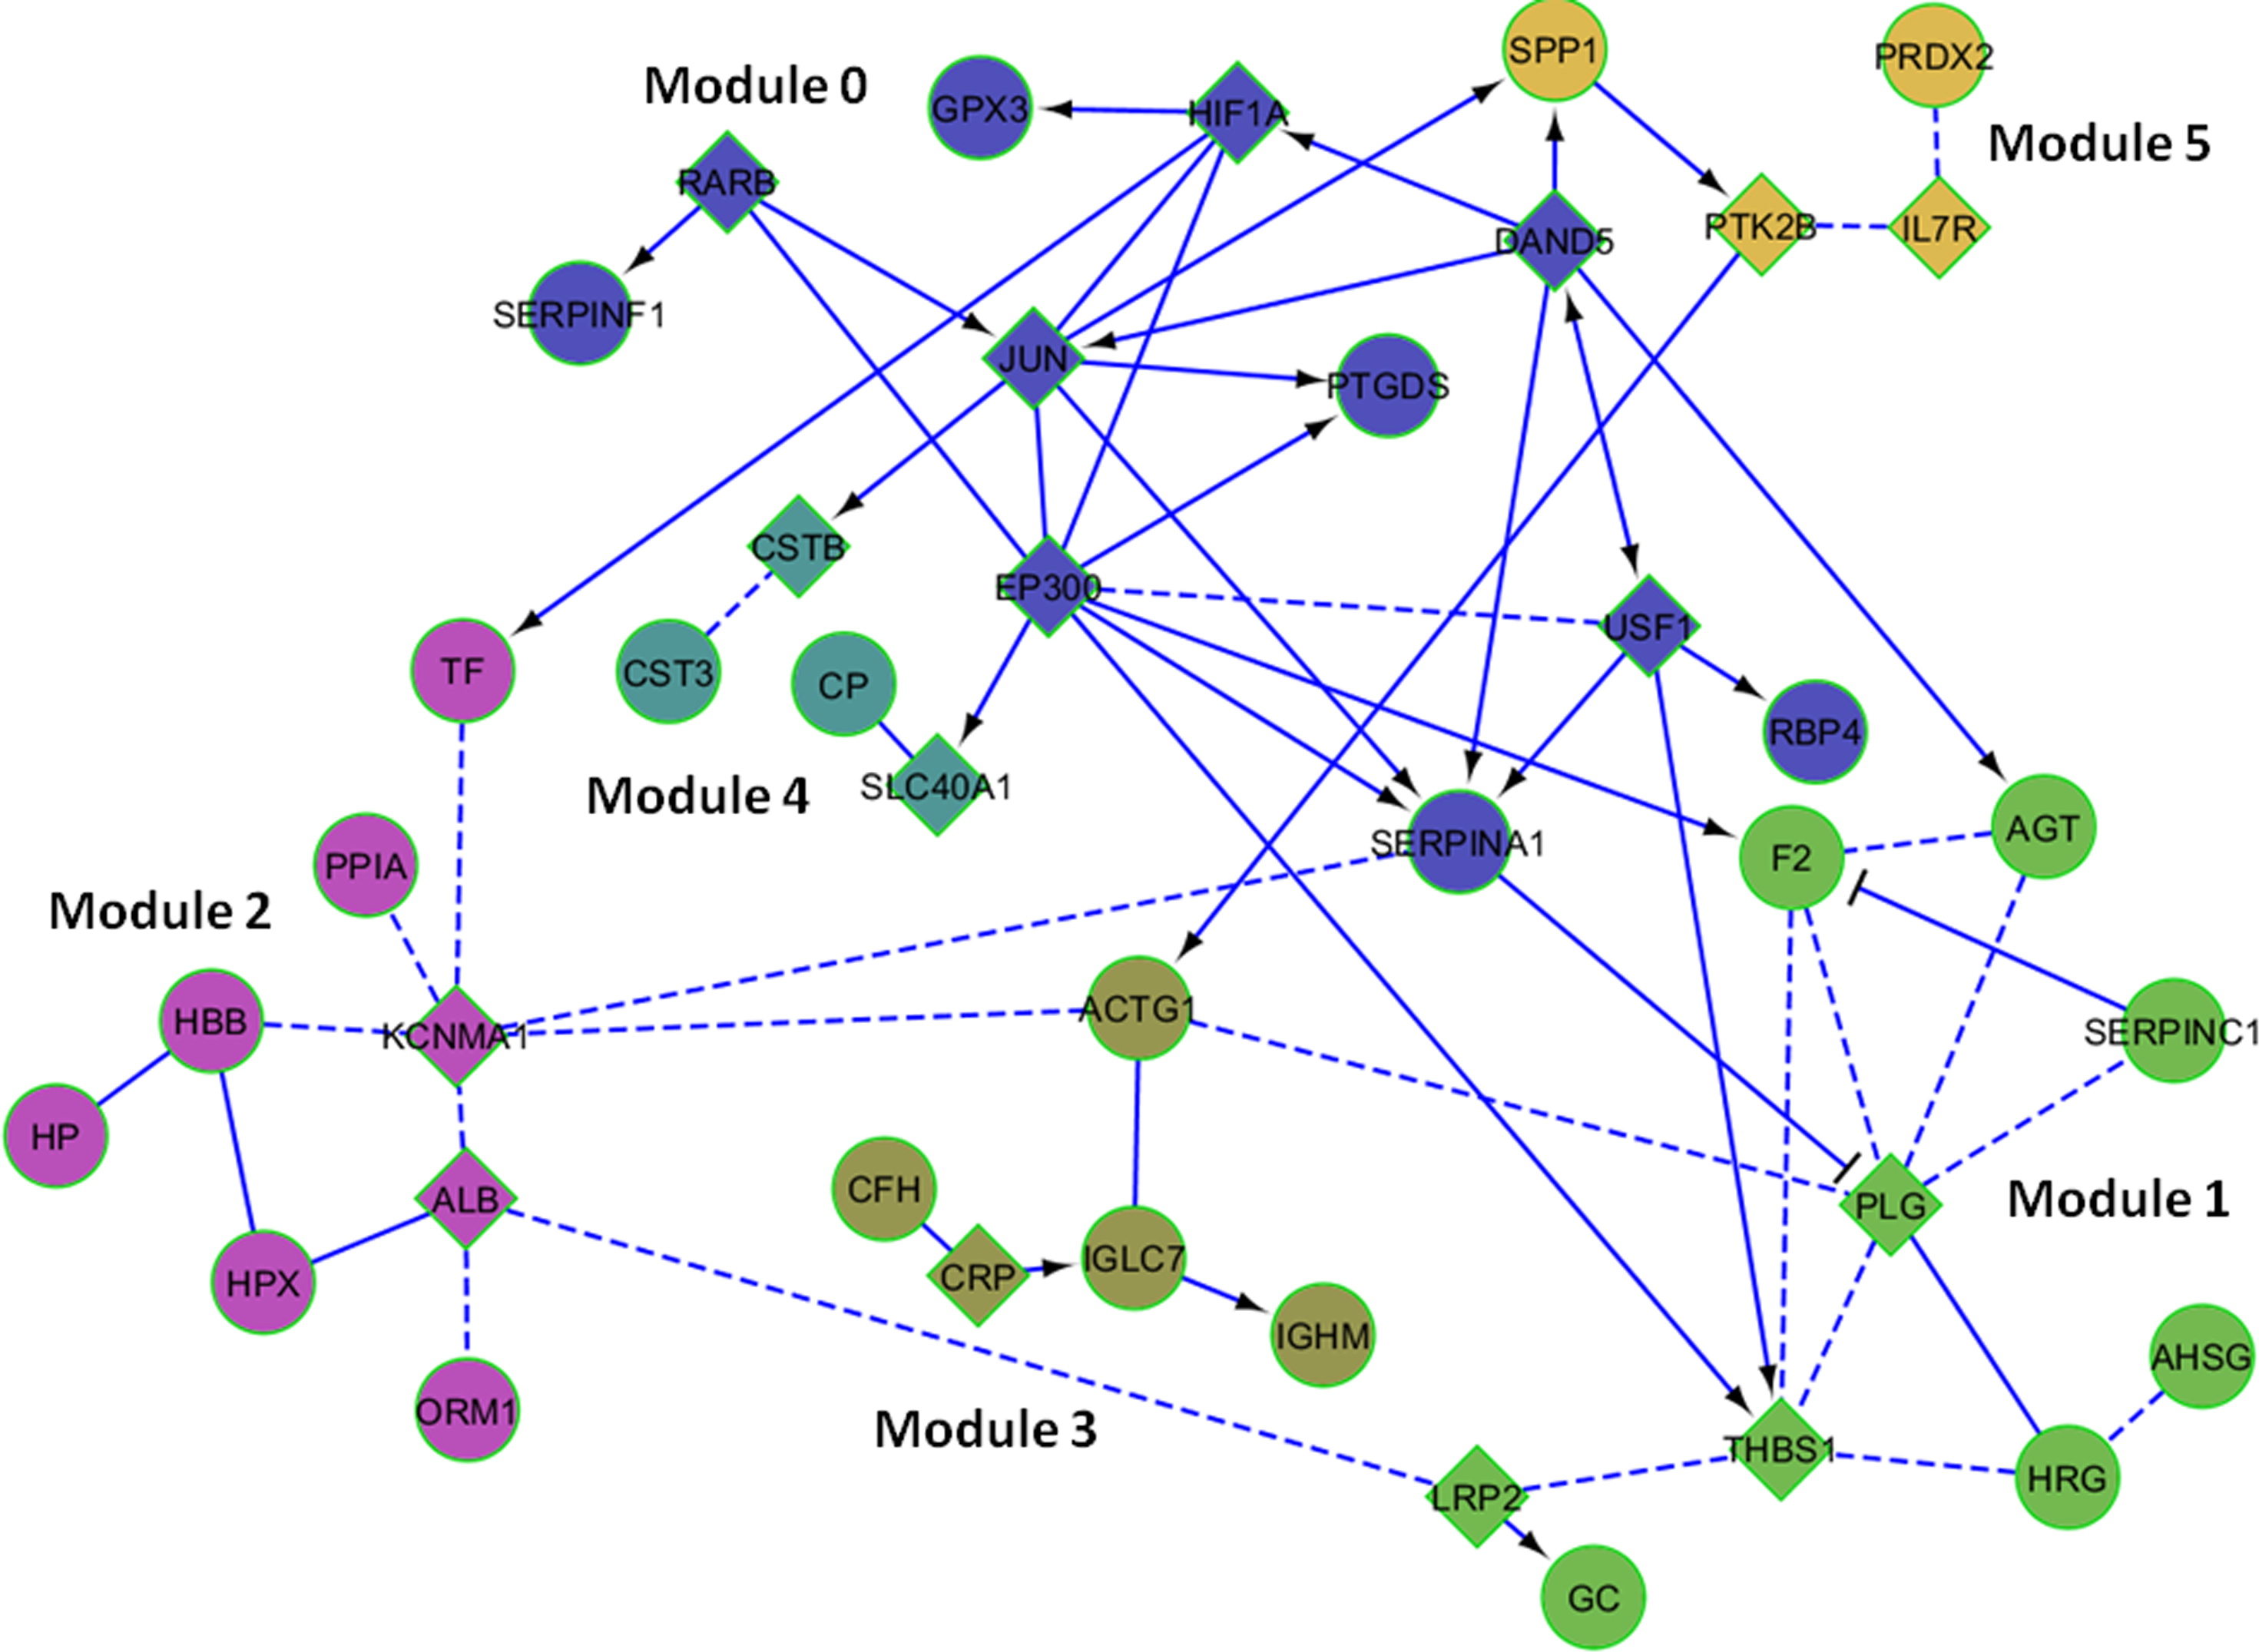
 Figure 4 of
Soria, Mol Vis 2015; 21:451-460.
Figure 4 of
Soria, Mol Vis 2015; 21:451-460.