Figure 3 of
Soria, Mol Vis 2015; 21:451-460.
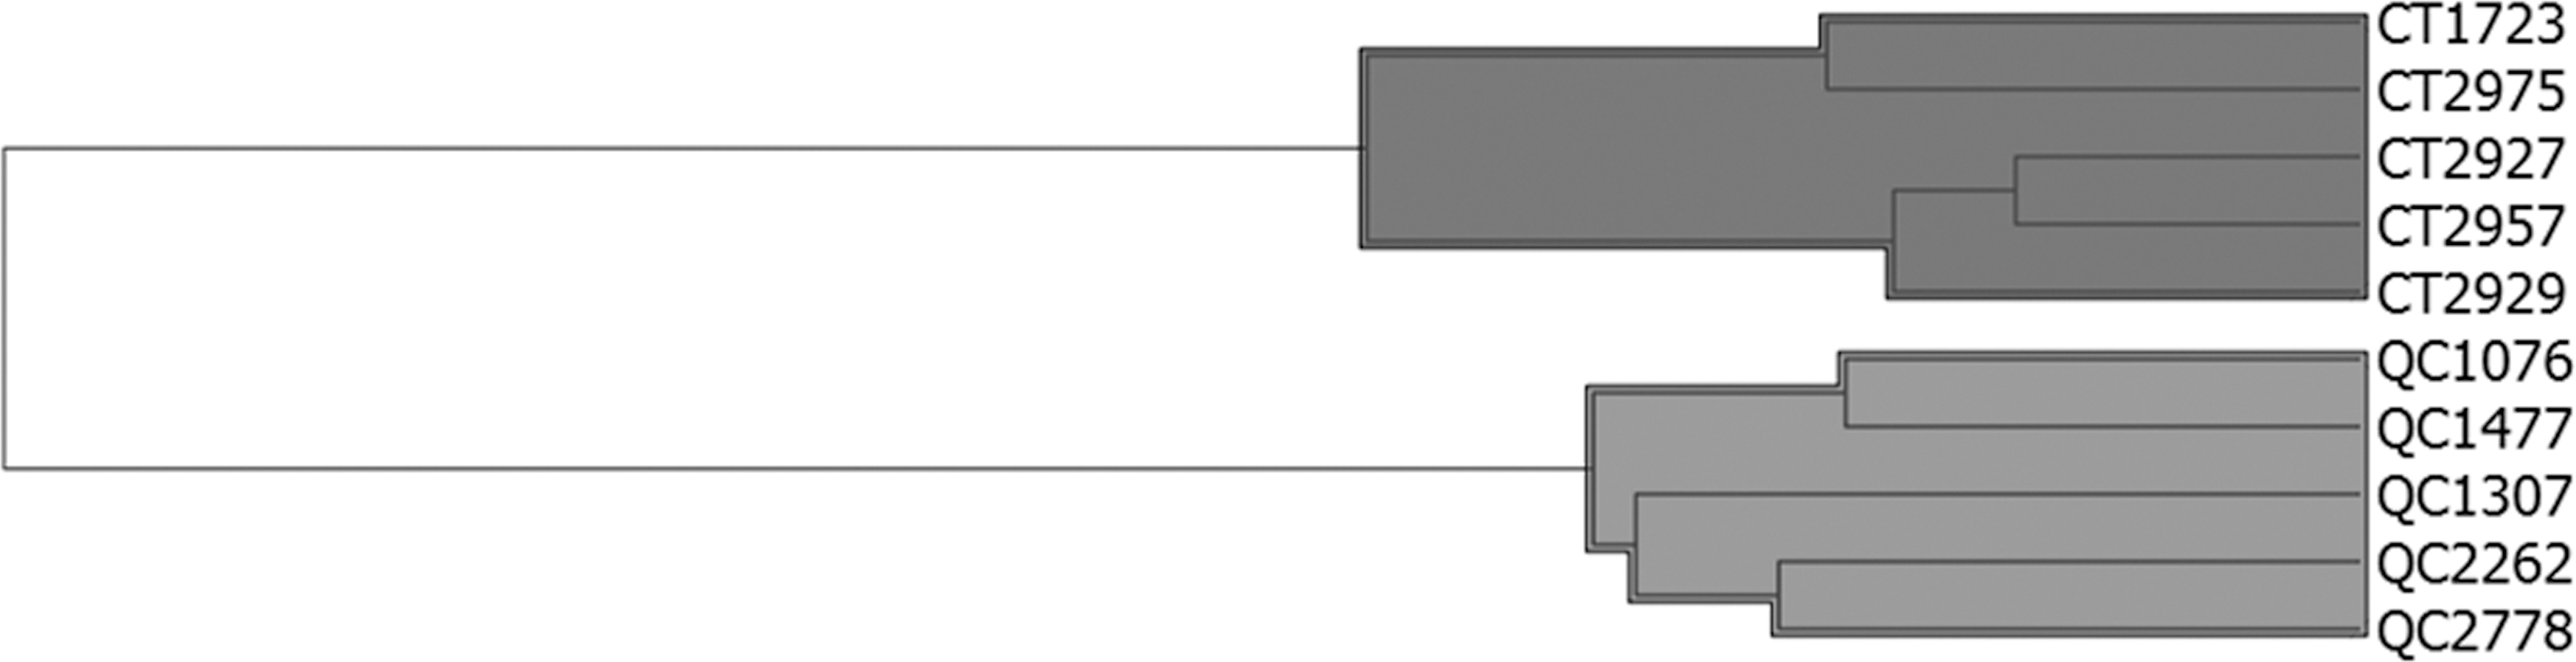
Figure 3.
Dendrogram obtained by agglomerative hierarchical clustering analysis. Each branch represents an individual with their study code (CT: control group; QC: keratoconus group).
 Figure 3 of
Soria, Mol Vis 2015; 21:451-460.
Figure 3 of
Soria, Mol Vis 2015; 21:451-460.