Figure 2 of
Soria, Mol Vis 2015; 21:451-460.
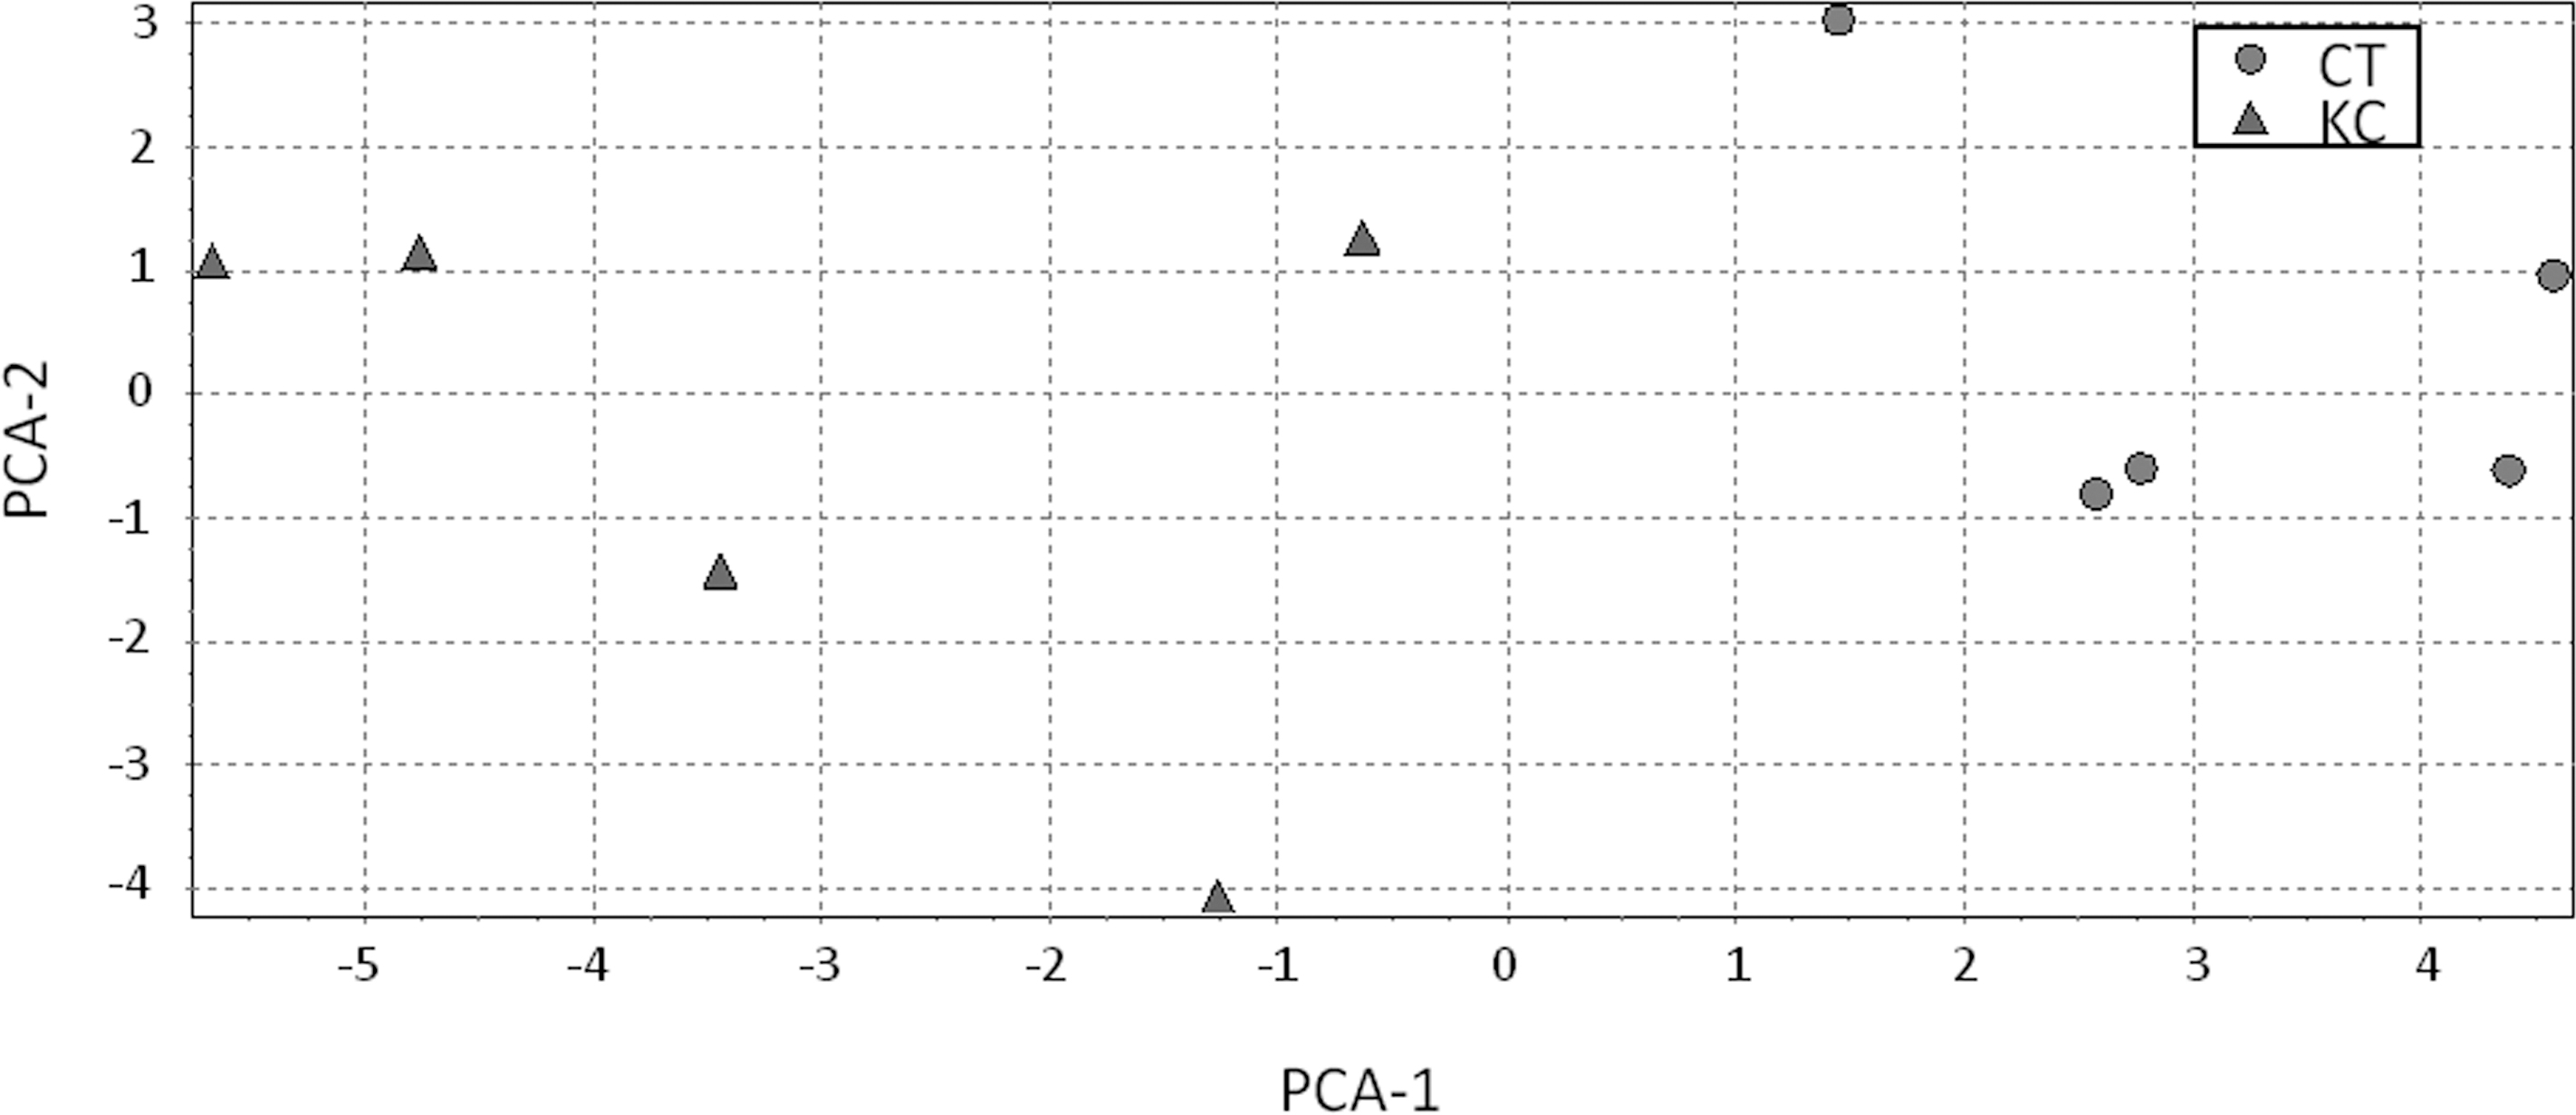
Figure 2.
Principal component analysis (PCA). Each symbol represents an individual, and the shape shows the group to which he/she belongs (circle: control - CT, triangle: keratoconus - KC).
 Figure 2 of
Soria, Mol Vis 2015; 21:451-460.
Figure 2 of
Soria, Mol Vis 2015; 21:451-460.