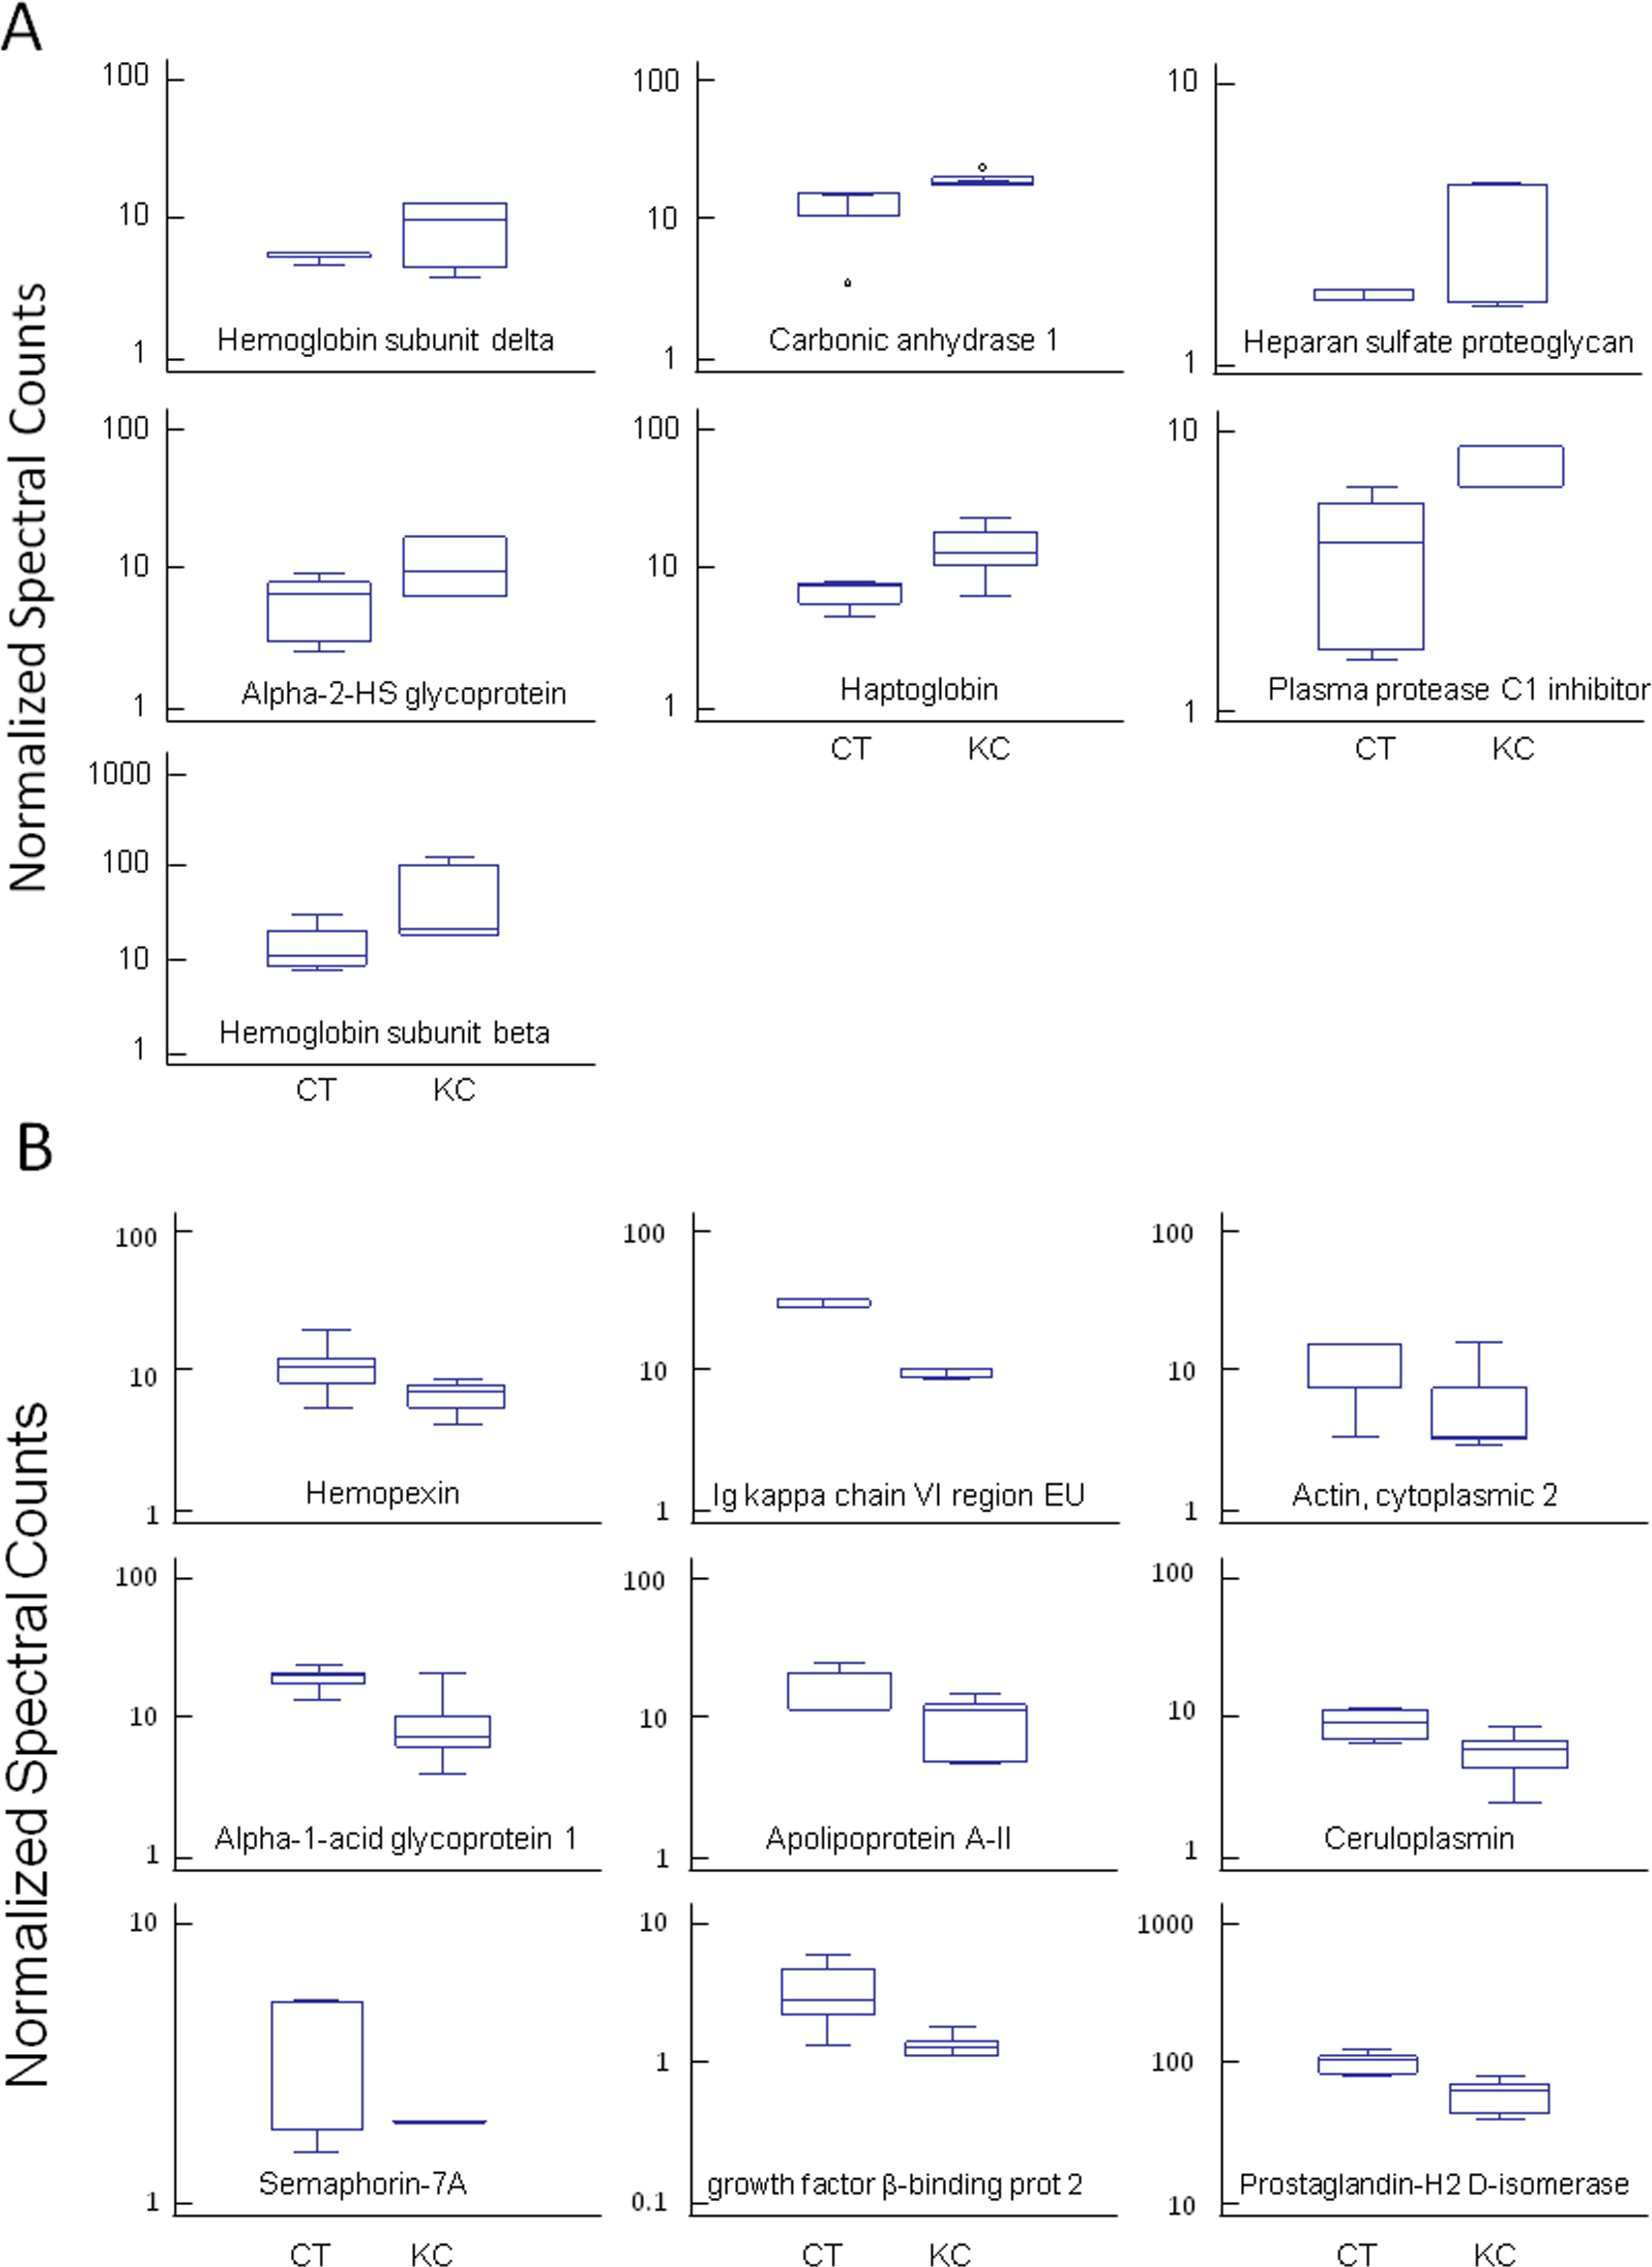
Figure 1. Whisker plot showing the mean expression values of proteins.
A. Proteins upregulated in keratoconic corneas, listed in
Table 3.
B. Whisker plot showing the mean expression values of proteins downregulated in keratoconic corneas, listed in
Table 3. KC=Keratoconus group; CT=control group.
 Figure 1 of
Soria, Mol Vis 2015; 21:451-460.
Figure 1 of
Soria, Mol Vis 2015; 21:451-460.