Figure 2. Comparative histograms of intracellular cytokines on helper CD30+ and CD30- T cell subsets. Peripheral blood mononuclear cells
(PBMCs) were Dermatophagoides pteronyssinus–stimulated for 7 d and stained with CD4, CD30, and intracellular interferon-gamma (IFN-γ), interleukin-4 (IL-4),
or IL-5 as described in the Materials and Methods section. Left panel, CD4+CD30- T cells; central panel, CD4+CD30+ T cells;
right panel, comparison of the frequency of cells positive to intracellular cytokines in either CD30+ or CD30- cell subsets.
Data are expressed as mean ± standard deviation (SD).
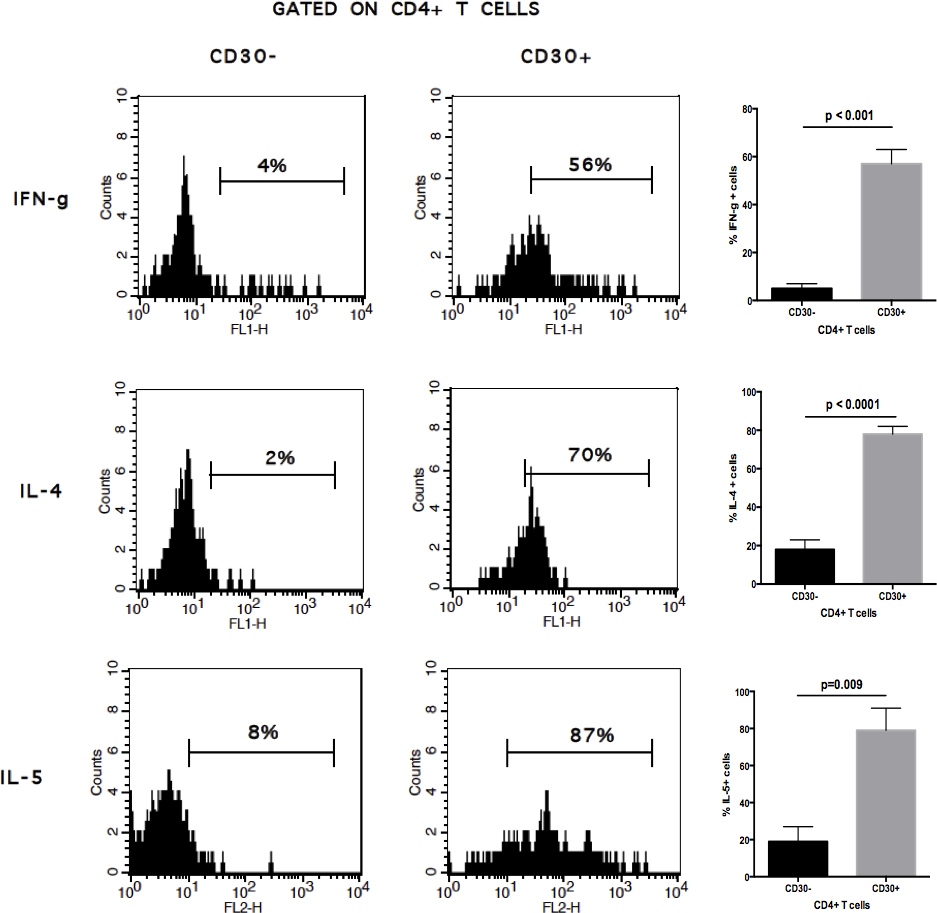
 Figure 2 of
Magaña, Mol Vis 2015; 21:443-450.
Figure 2 of
Magaña, Mol Vis 2015; 21:443-450.