Figure 1. Scatter plots of total protein in the vitreous of patients with RRDCD and RRD. The bicinchoninic acid protein assay was used
to compare the total protein concentrations in the vitreous between the rhegmatogenous retinal detachment associated with
choroidal detachment (RRDCD) and rhegmatogenous retinal detachment (RRD) groups. The vertical bars represent the median and
the range.
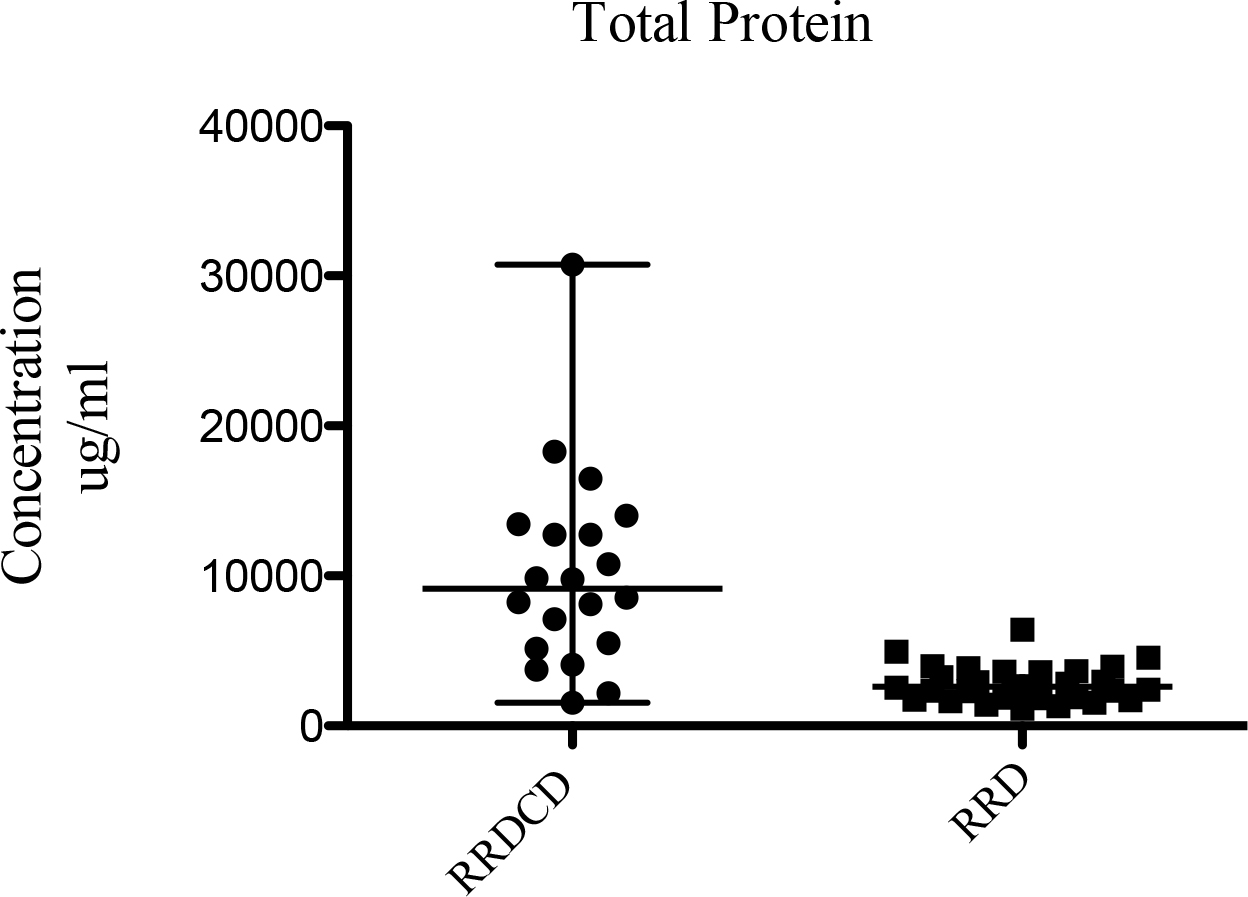
 Figure 1 of
Dai, Mol Vis 2015; 21:417-427.
Figure 1 of
Dai, Mol Vis 2015; 21:417-427.