Figure 14. Strain differences in cell density. The density of RPE cells was calculated per 75,000 square micron area. The cell densities
of three genotypes, one wild type (WT), C57Bl/6J, and two models of retinal degeneration, IRBP−/− and rd8, were compared at two ages, postnatal days (P)30 and P720. N=4–5 animals for each genotype at P30, and n=3 animals at each
genotype at P720. The cell density of IRBP−/− was decreased at P30 compared to WT, but its density remained steady through P720, while that of the WT dropped slightly.
The cell density in rd8 was similar to WT at P30, but the rd8 density decreased markedly by P720, while that of the WT remained steady.
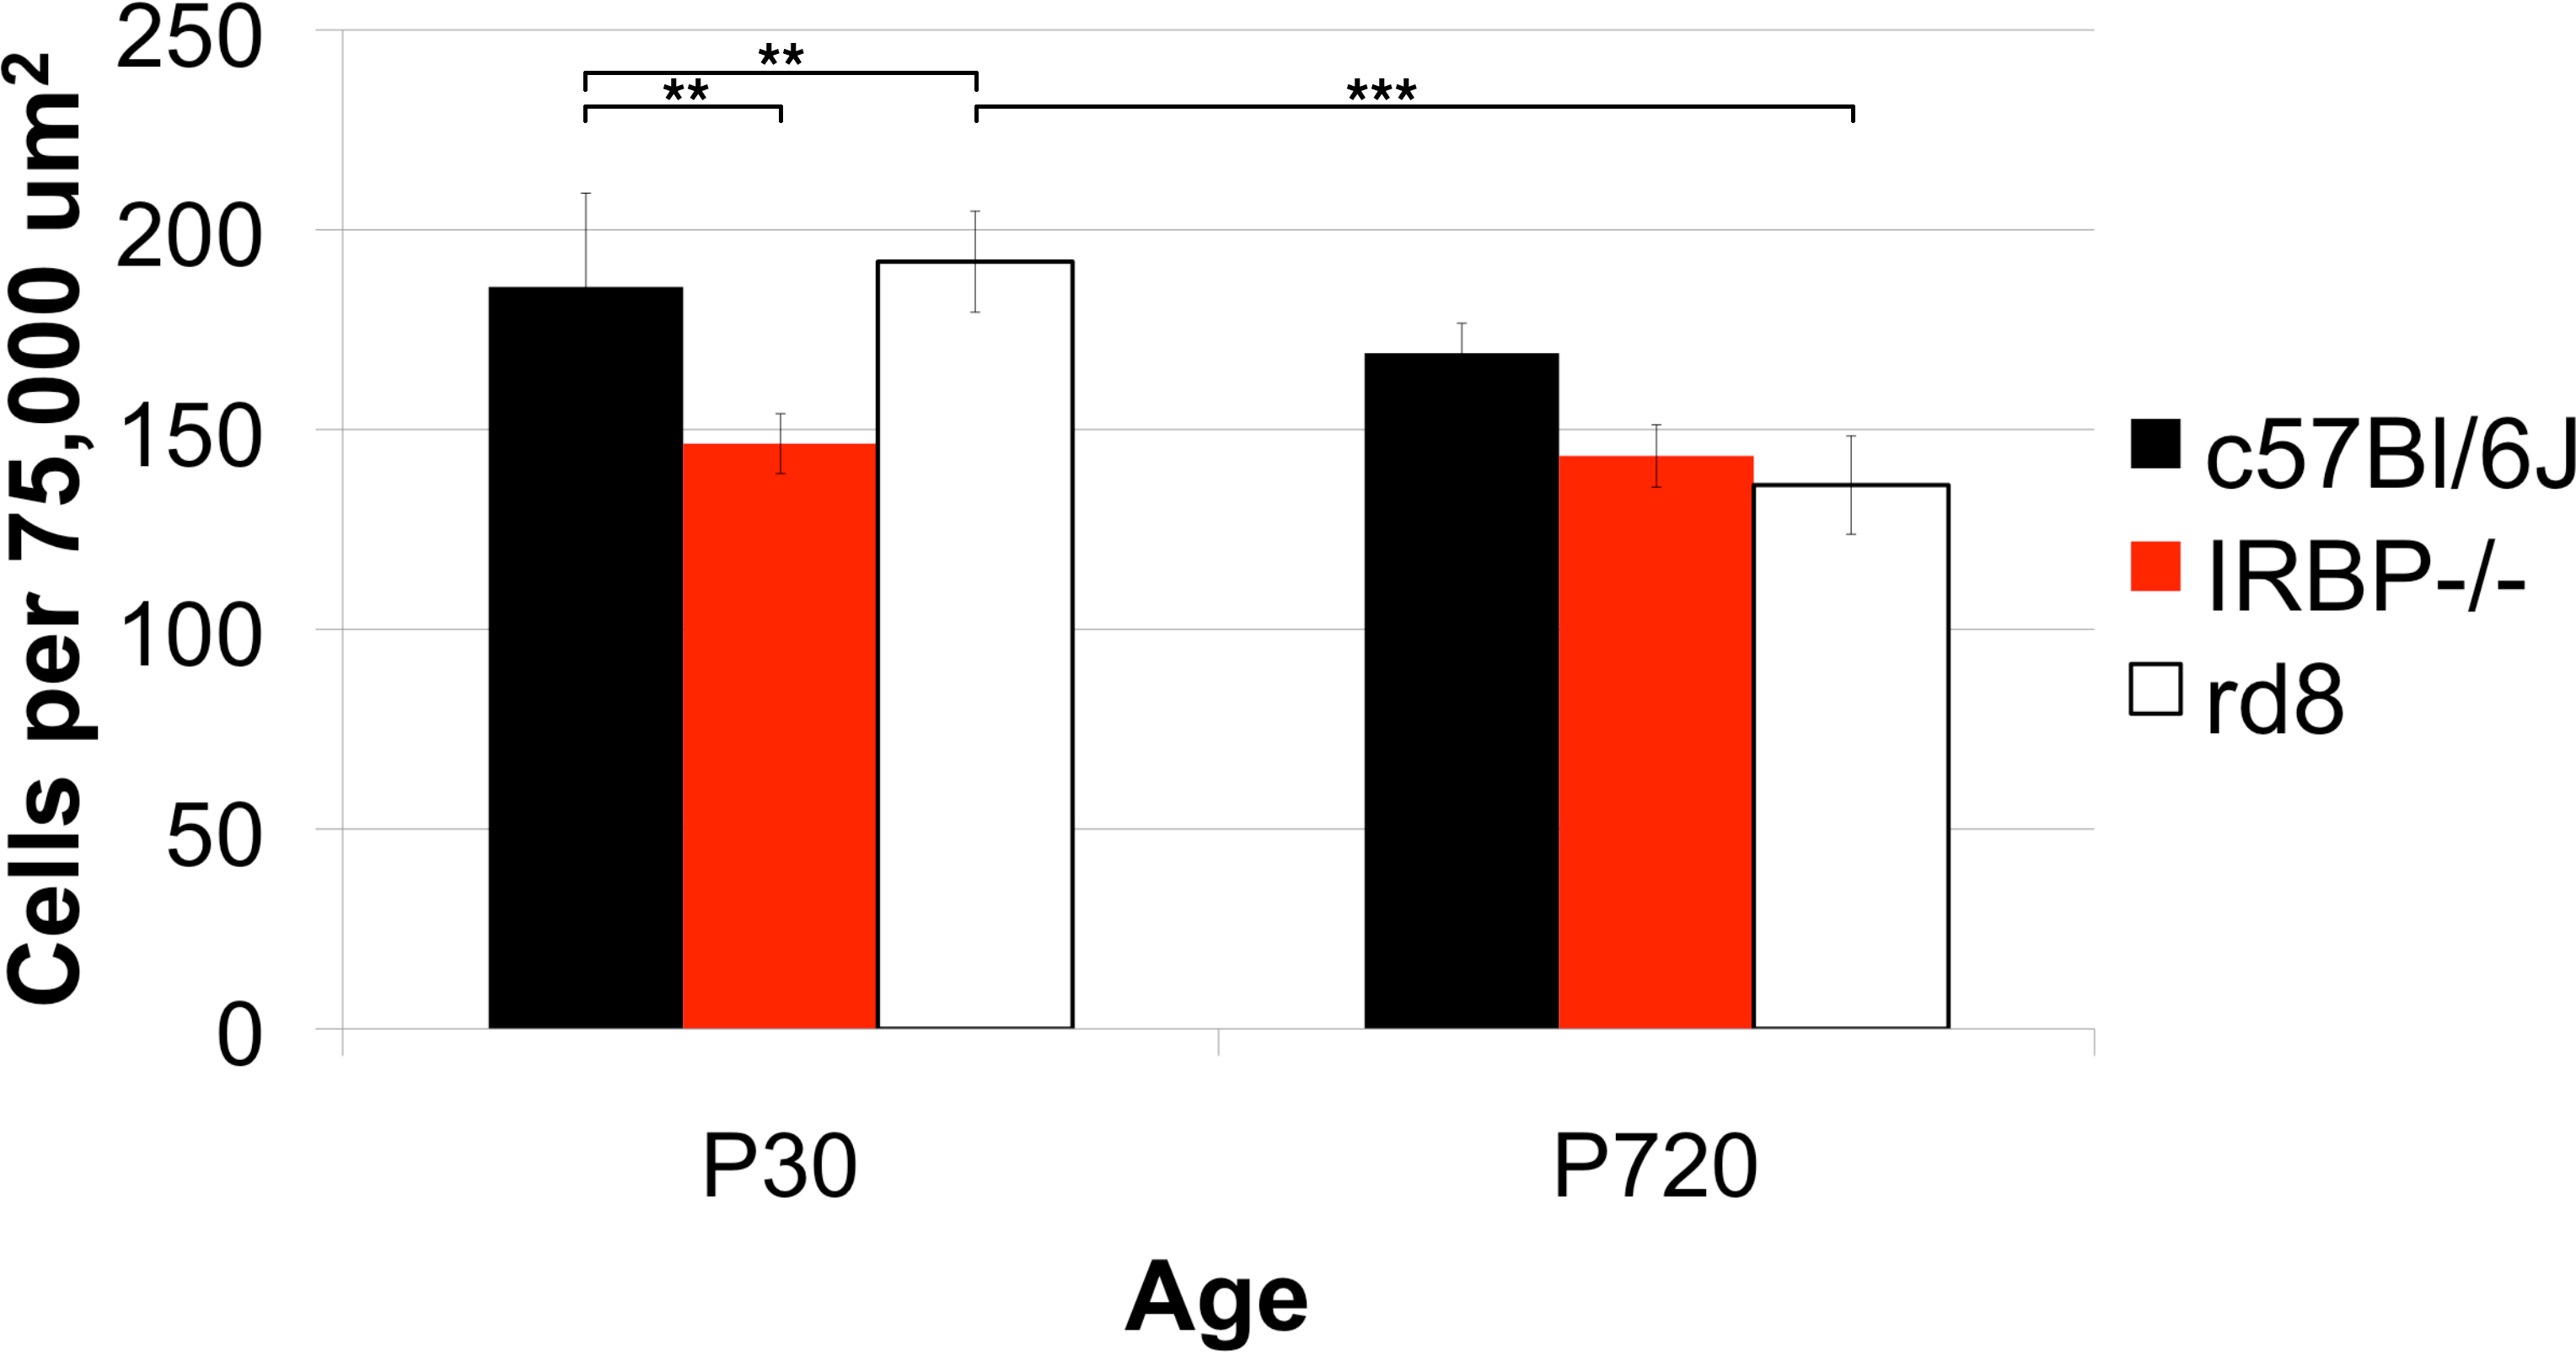
 Figure 14 of
Boatright, Mol Vis 2015; 21:40-60.
Figure 14 of
Boatright, Mol Vis 2015; 21:40-60.