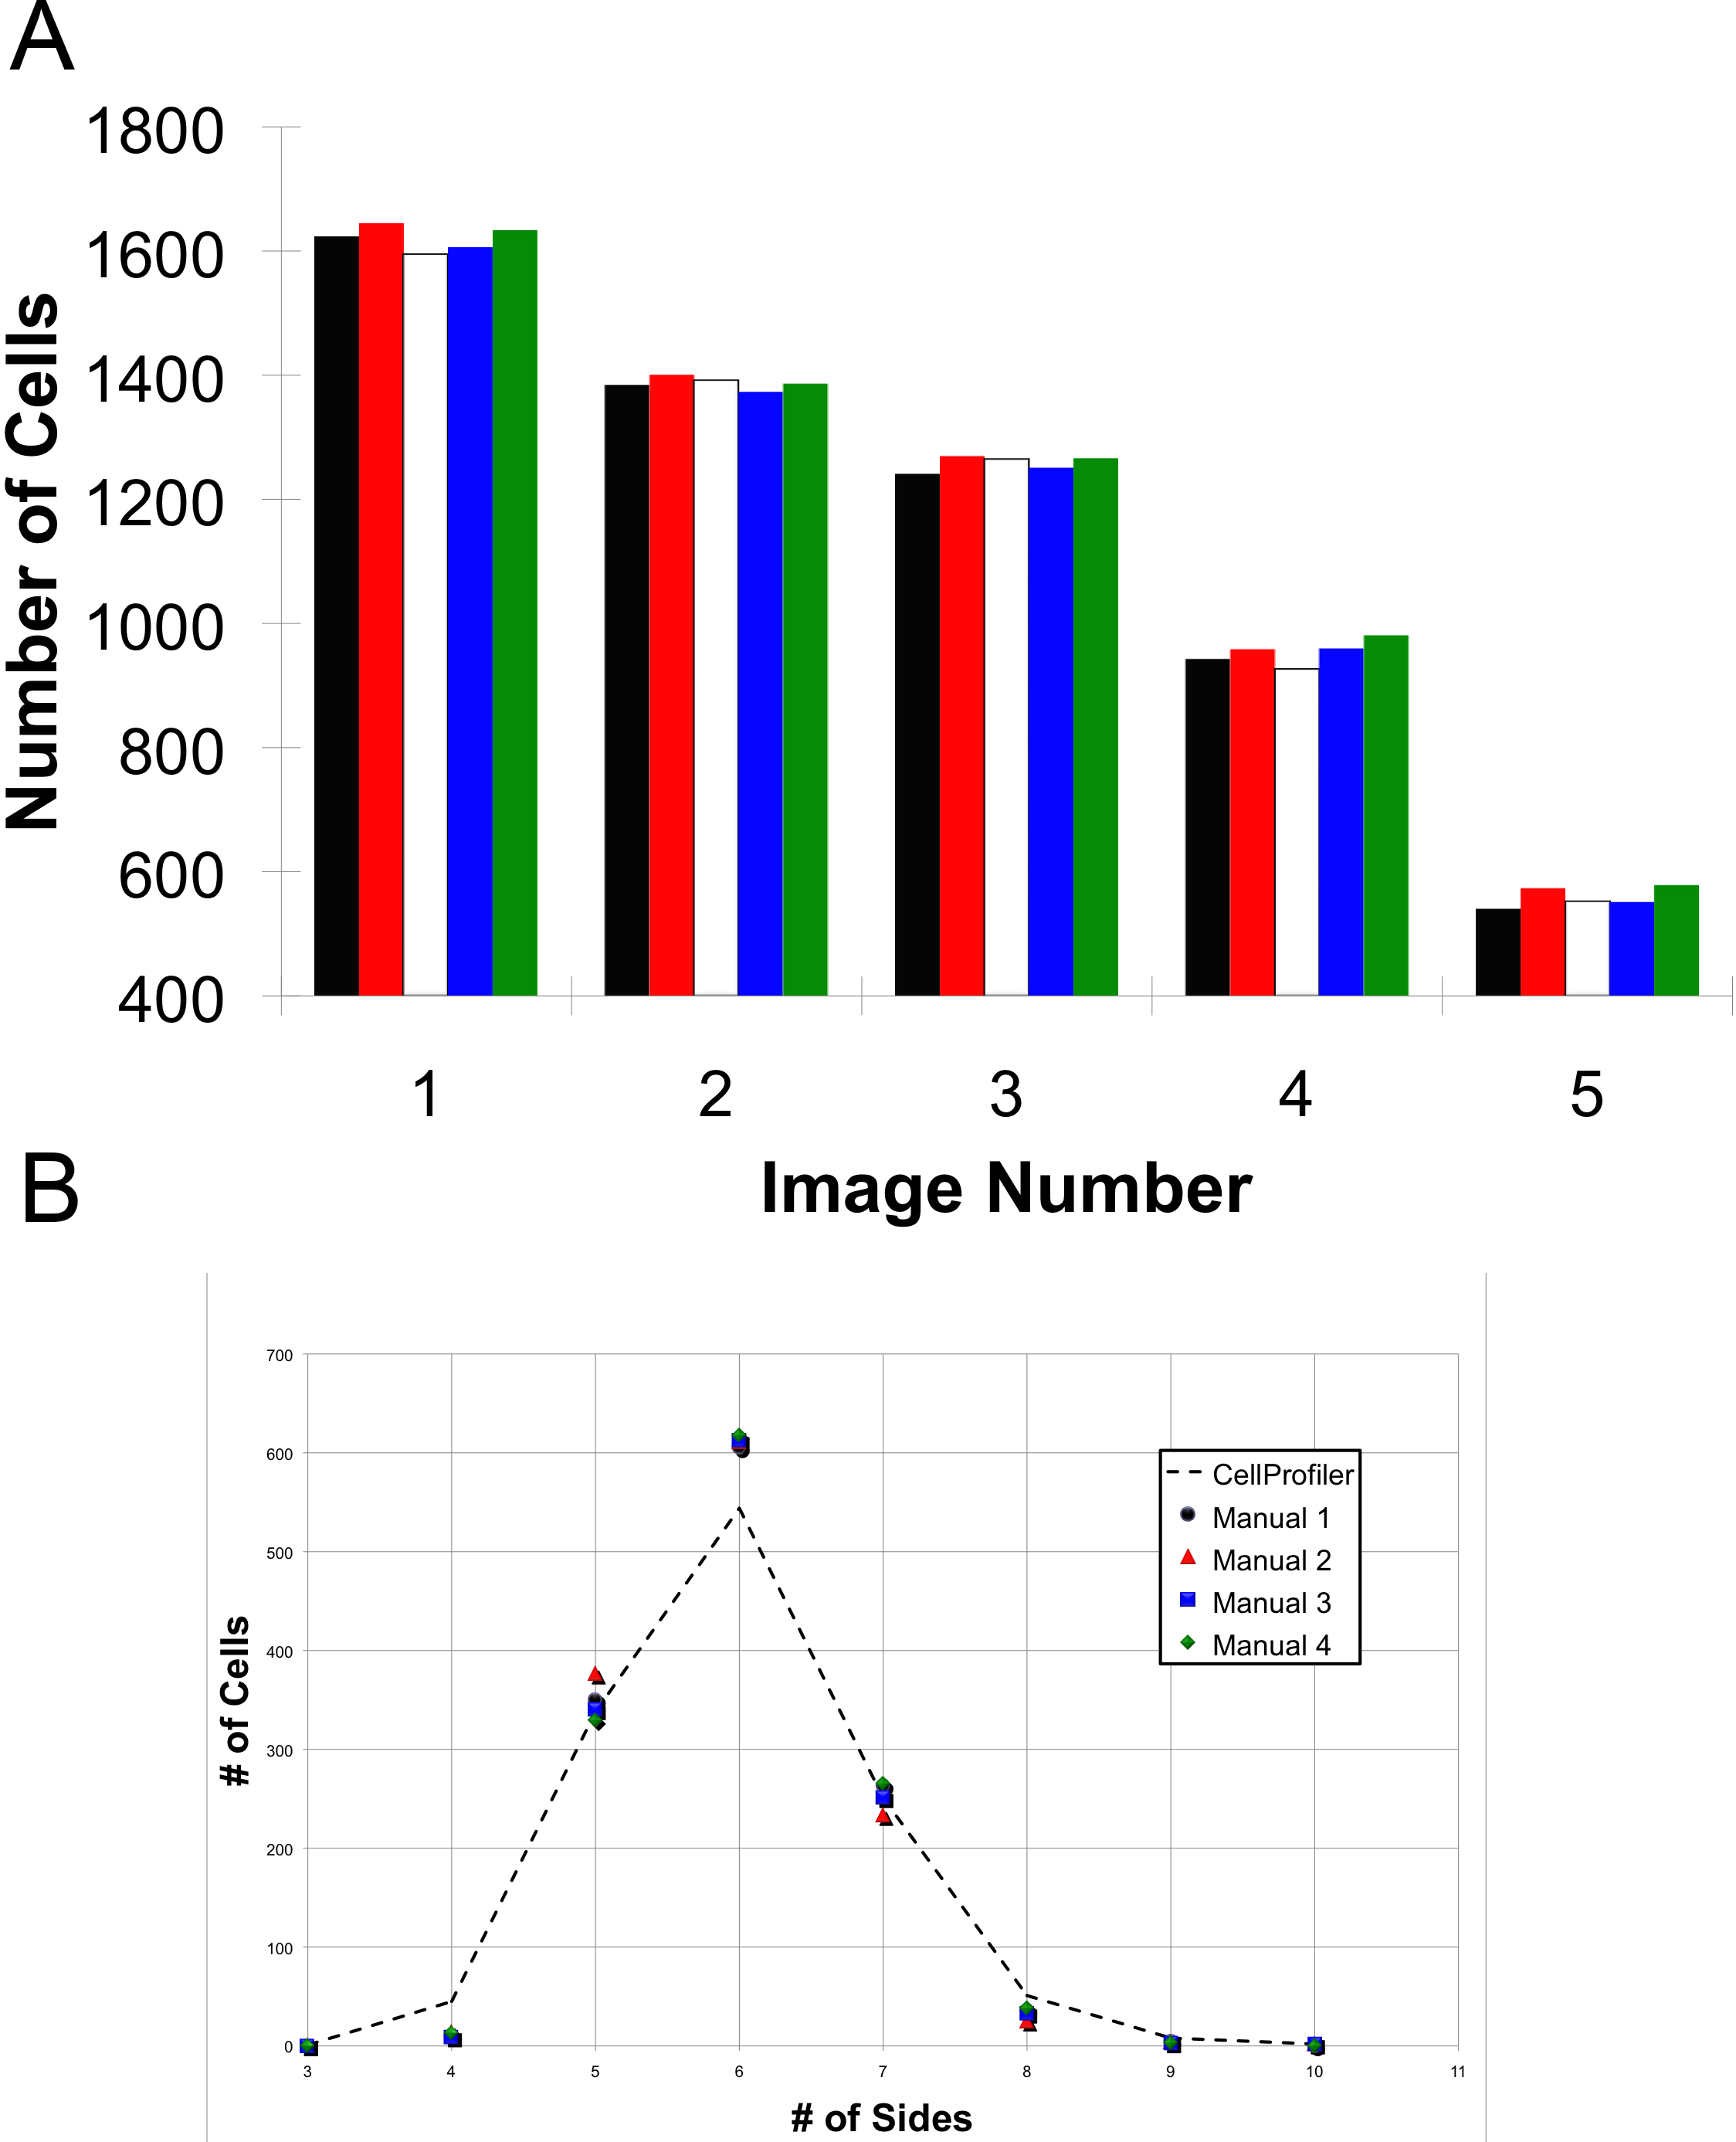
Figure 12. Interobserver variability compared to
CellProfiler. Five images were counted manually four times by three independent observers and automatically by
CellProfiler once. The
CellProfiler results were similar to the four manual counts by proportion of cell neighbors and by total cell counts.
A: Validation by total cell counts.
CellProfiler’s count is outlined in red. The five images varied in size from approximately 550 to 1,600 cells.
B:
CellProfiler’s accuracy on the counting of cells with a given number of sides, displayed in a scatter plot compared to four manual counts.
 Figure 12 of
Boatright, Mol Vis 2015; 21:40-60.
Figure 12 of
Boatright, Mol Vis 2015; 21:40-60.