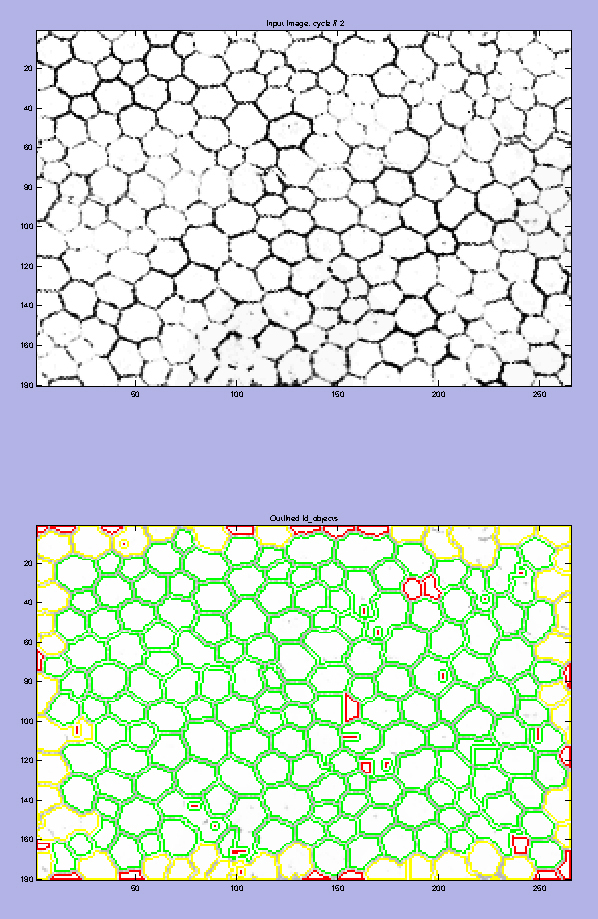
Figure 11. Comparison of an input image and its resulting segmentation.
A: The input image is shown at the top. The
primauto output file (lower image) from
CellProfiler shows cells within the image that were identified as objects to count and measured in green. Those cells that it does not
recognize as objects are outlined in red, and those that touch the border are outlined in yellow. These images may be used
as a qualitative judge of
CellProfiler’s ability to identify objects in a given image. The “percent of the image consisting of objects” reported by
CellProfiler was used as a quantitative threshold when screening for accurate cell identification.
 Figure 11 of
Boatright, Mol Vis 2015; 21:40-60.
Figure 11 of
Boatright, Mol Vis 2015; 21:40-60.