Figure 6. Real-time RT–PCR analysis of MMP-2, MMP-9, VEGFA, CTGF, VEGFR-1, cathepsin D, TIMP-1, TIMP-2, and α-SMA expression in RPE
cell cultures treated with bevacizumab. Cultures incubated with DMEM:F12 (1:1) supplemented with bevacizumab (0.25, 0.5, and
0.8 mg/ml concentrations) and without bevacizumab as the control. After 48 h, RNA was extracted, and gene expression analysis
was performed with quantitative real-time RT–PCR as described in the Methods section. mRNA levels were normalized to glyceraldehyde
3-phosphate dehydrogenase (GAPDH) and presented as folds of the control values. Bevacizumab increased matrix metalloproteinase-2 (MMP-2) and MMP-9 gene expression
when applied at 0.8 mg/ml. Cathepsin D was increased in cultures incubated with 0.5 and 0.8 mg/ml of the drug. Expression
of vascular endothelial growth factor A (VEGFA) and VEGF receptor-1 (VEGFR-1) was decreased in the 0.25, 0.5, and 0.8 mg/ml
concentrations. CTGF expression was increased at 0.25 mg/ml unaffected at 0.5 mg/ml and reduced at 0.8 mg/ml of bevacizumab
compared to the control. Each column shows comparison of specified treated culture with control culture (% of control) and
each bar represents the mean ± standard deviation (SD) of at least three independent experiments performed in duplicate (*p<0.05).
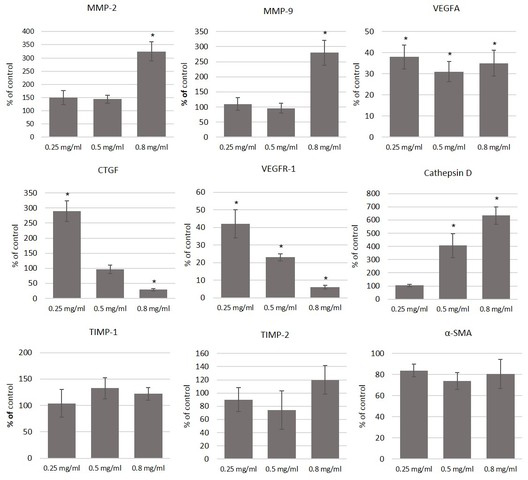
 Figure 6 of
Bagheri, Mol Vis 2015; 21:378-390.
Figure 6 of
Bagheri, Mol Vis 2015; 21:378-390.