Figure 4. Expression of AQP subtypes in freshly isolated and cultured human RPE cells. A. Comparison of the expression levels of AQP1–12 genes in freshly isolated and cultured RPE cells. Bars represent means ± SEM
normalized cycle thresholds (ΔCT) required to detect mRNA in real-time RT–PCR. The smaller the ΔCT value, the higher the cellular
mRNA level. The values were obtained in four independent preparations of freshly isolated cells from different donors and
in three independent cultures using cells from different donors, respectively. Significant difference: *p<0.05. B. Immunolabeling of cultured human RPE cells with antibodies against AQP5 (green) and vimentin (red). Cell nuclei were labeled with Hoechst 33,258 (blue). Right: Negative control cells stained without primary antibodies. Bars, 20 µm.
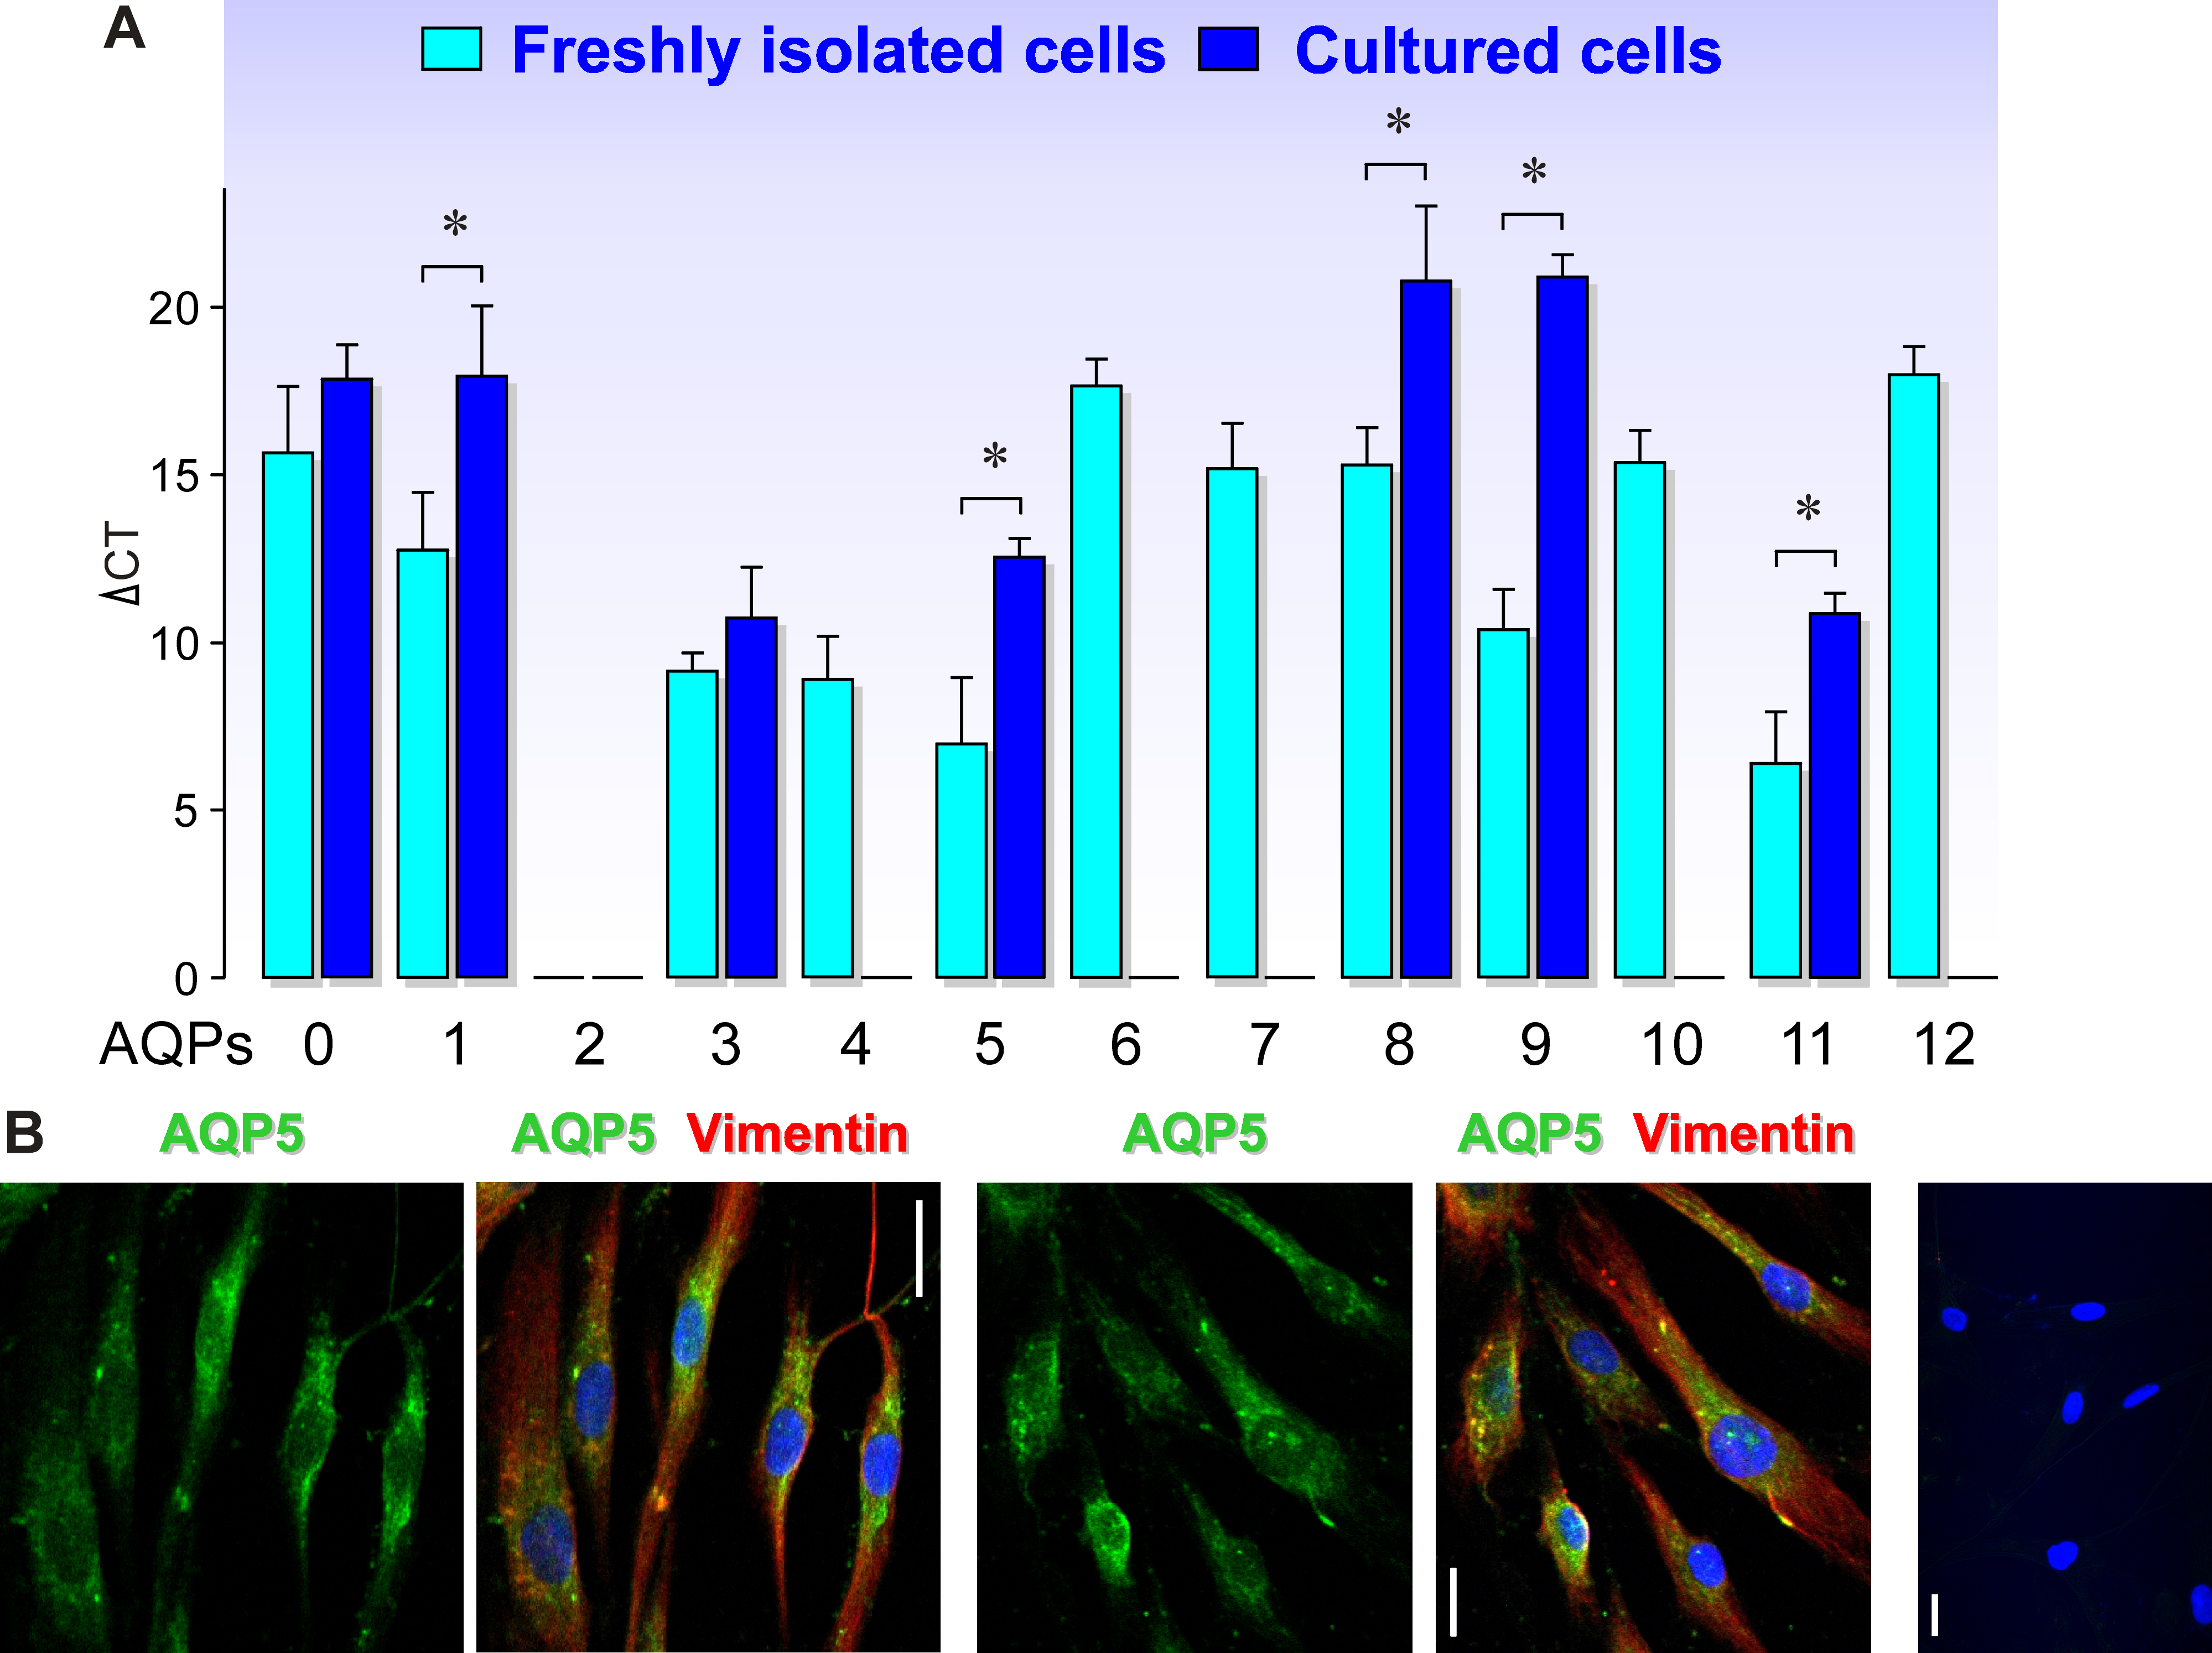
 Figure 4 of
Hollborn, Mol Vis 2015; 21:360-377.
Figure 4 of
Hollborn, Mol Vis 2015; 21:360-377.