Figure 3. Involvement of signal transduction pathways in the hyperosmotic induction of VEGF in RPE cells. The mRNA level (A) was determined with real-time RT–PCR analysis in cells cultured 6 h under iso- (control) and hyperosmotic conditions (+
100 mM NaCl), and is expressed as folds of isoosmotic unstimulated control. The level of VEGF-A165 protein (B) was determined with ELISA in the media of cells cultured 24 h under iso- and hyperosmotic conditions, and is expressed in
a percentage of isoosmotic unstimulated control (100%, corresponding to 281.7±45.8 pg/ml VEGF). The cytosolic protein levels
(C) were determined by western blot analysis. A. The hyperosmotic upregulation of VEGFA was decreased by the inhibitor of p38 MAPK activation, SB203580 (10 µM; n=6); the inhibitor of ERK1/2 activation, PD98059
(20 µM; n=6); the JNK inhibitor SP600125 (10 µM; n=5); and the inhibitor of PI3K-related kinases, LY294002 (5 µM; n=6), respectively.
The inhibitor of the PDGF receptor tyrosine kinase, tyrphostin AG1296 (10 µM; n=5), and the inhibitor of the EGF receptor
tyrosine kinase, AG1478 (600 nM; n=5), did not inhibit the hyperosmotic upregulation of VEGFA. The vehicle control was made with DMSO (1%; n=3). B. The inhibitors of p38 MAPK (n=5), ERK1/2 (n=5), JNK (n=5), and PI3K (n=5) also decreased the secretion of VEGF induced by
hyperosmotic stimulation. C. Stimulation of the cells for 20 min with CoCl2 (150 µM) or hyperosmotic medium (+ 100 mM NaCl) induced the phosphorylation of p38 and ERK1/2 proteins. PDGF (10 ng/ml) was
used as a positive control. Amounts of total proteins are shown above; amounts of phosphorylated proteins are shown below.
Similar results were obtained in three independent experiments using cells from different donors. Bars represent means ± SEM
obtained in independent experiments performed in triplicate. Significant difference versus isoosmotic unstimulated control:
*p<0.05. Significant difference versus NaCl control: ●p<0.05.
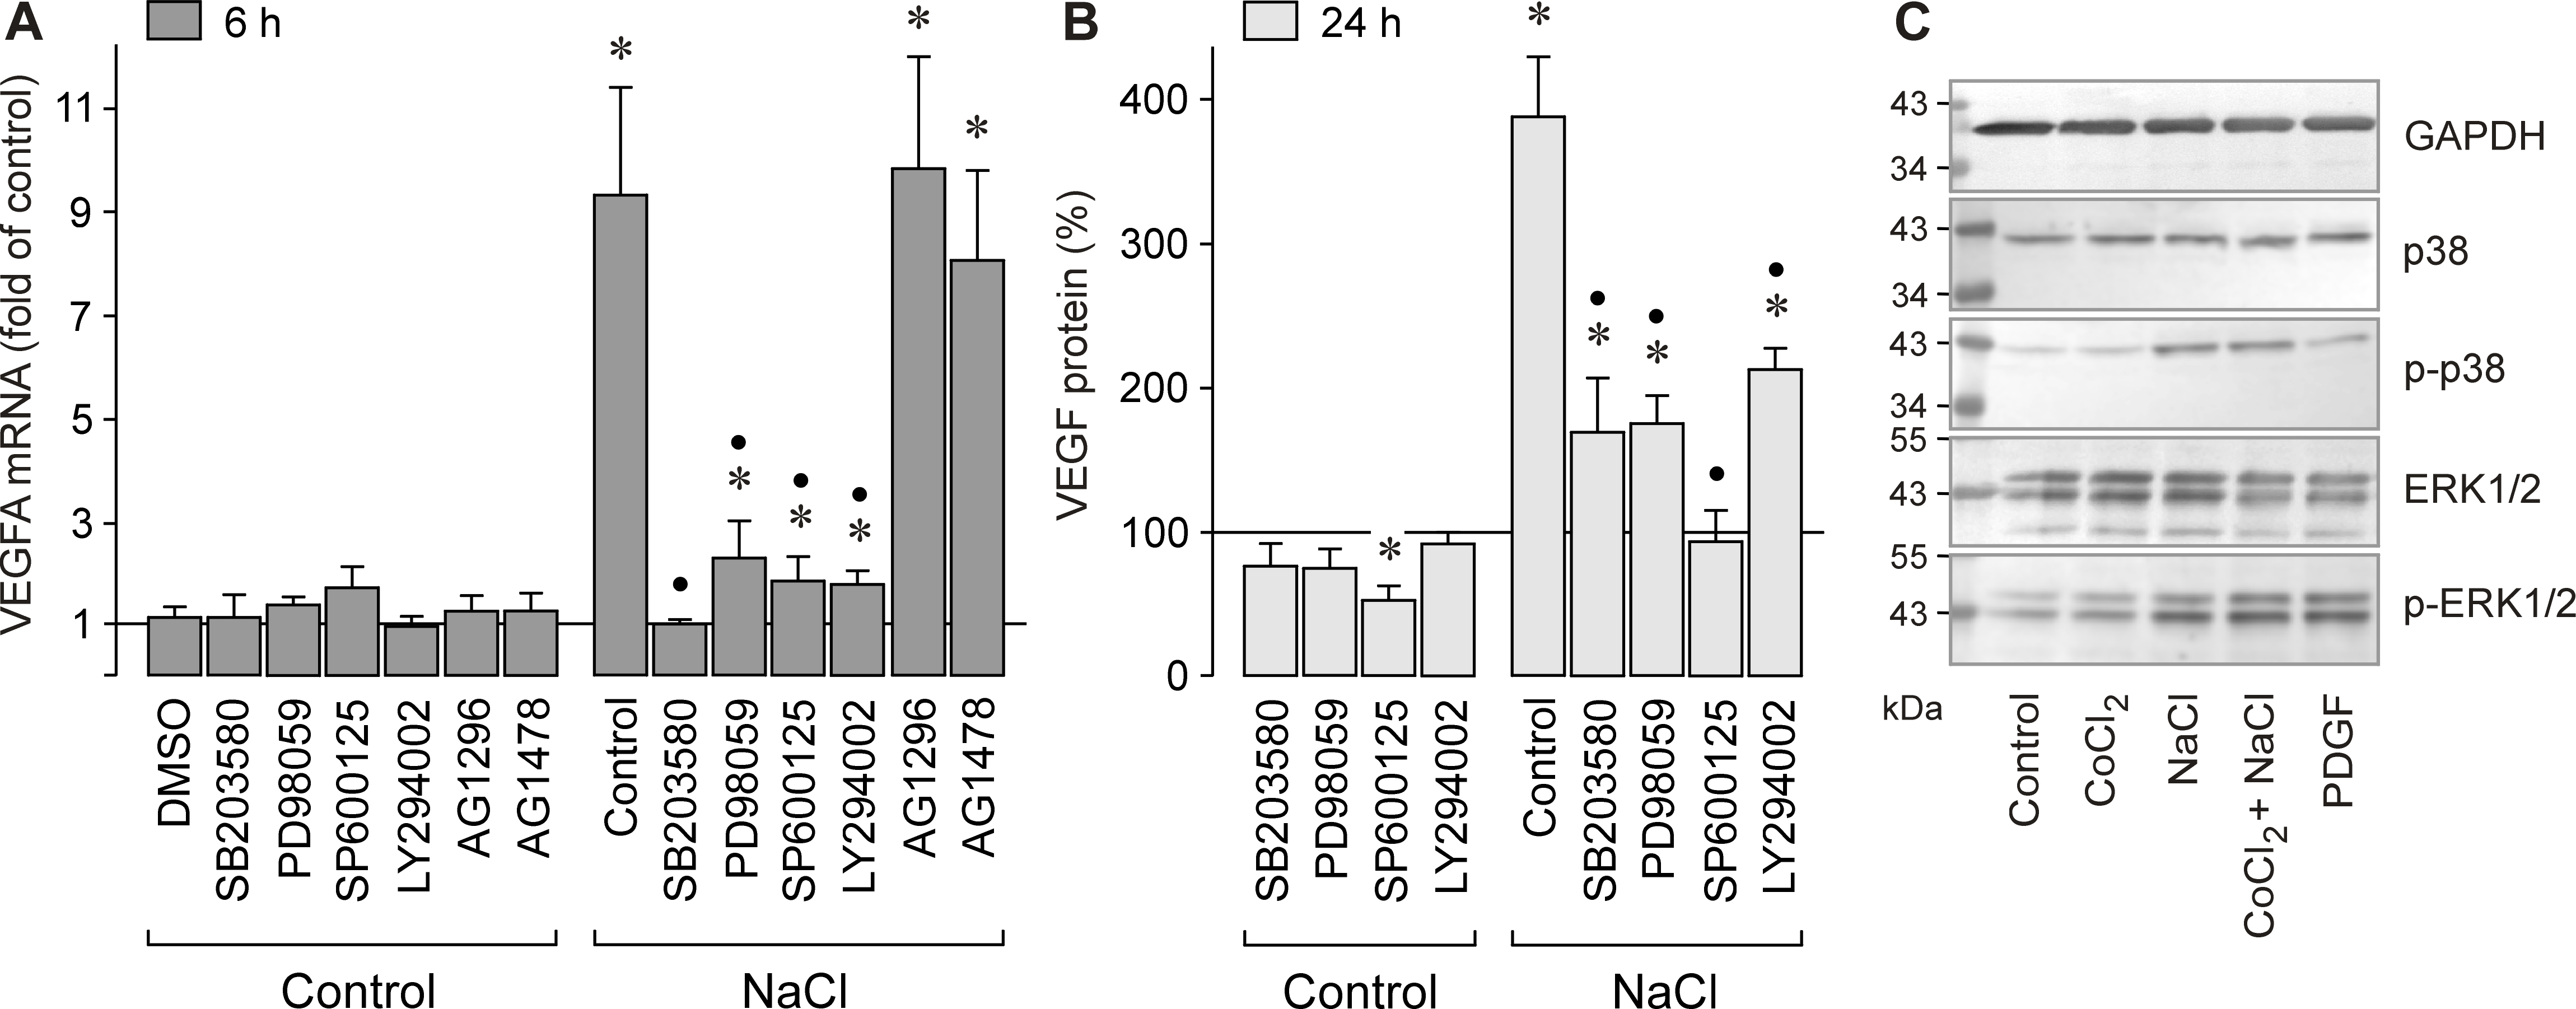
 Figure 3 of
Hollborn, Mol Vis 2015; 21:360-377.
Figure 3 of
Hollborn, Mol Vis 2015; 21:360-377.