Figure 7. Dose-responsive effect of ATP on [Ca2+]i in fhRPE cells. A: Represented by normalized change in percent fluorescence, the responses in [Ca2+] to 5 µM ATP are shown for control fhRPE and fhRPE overexpressing hBest1 or hBest1W93CB: Dose response curves for the initial rise in [Ca2+]i as a function of ATP concentration are shown for control monolayers and for monolayers overexpressing wild-type or mutant
hBest1. ATP doses were between 1 and 100 µM. Differences in responses between each group were significant by ANOVA (p<0.003,
n≥5). Data are mean ± SEM.
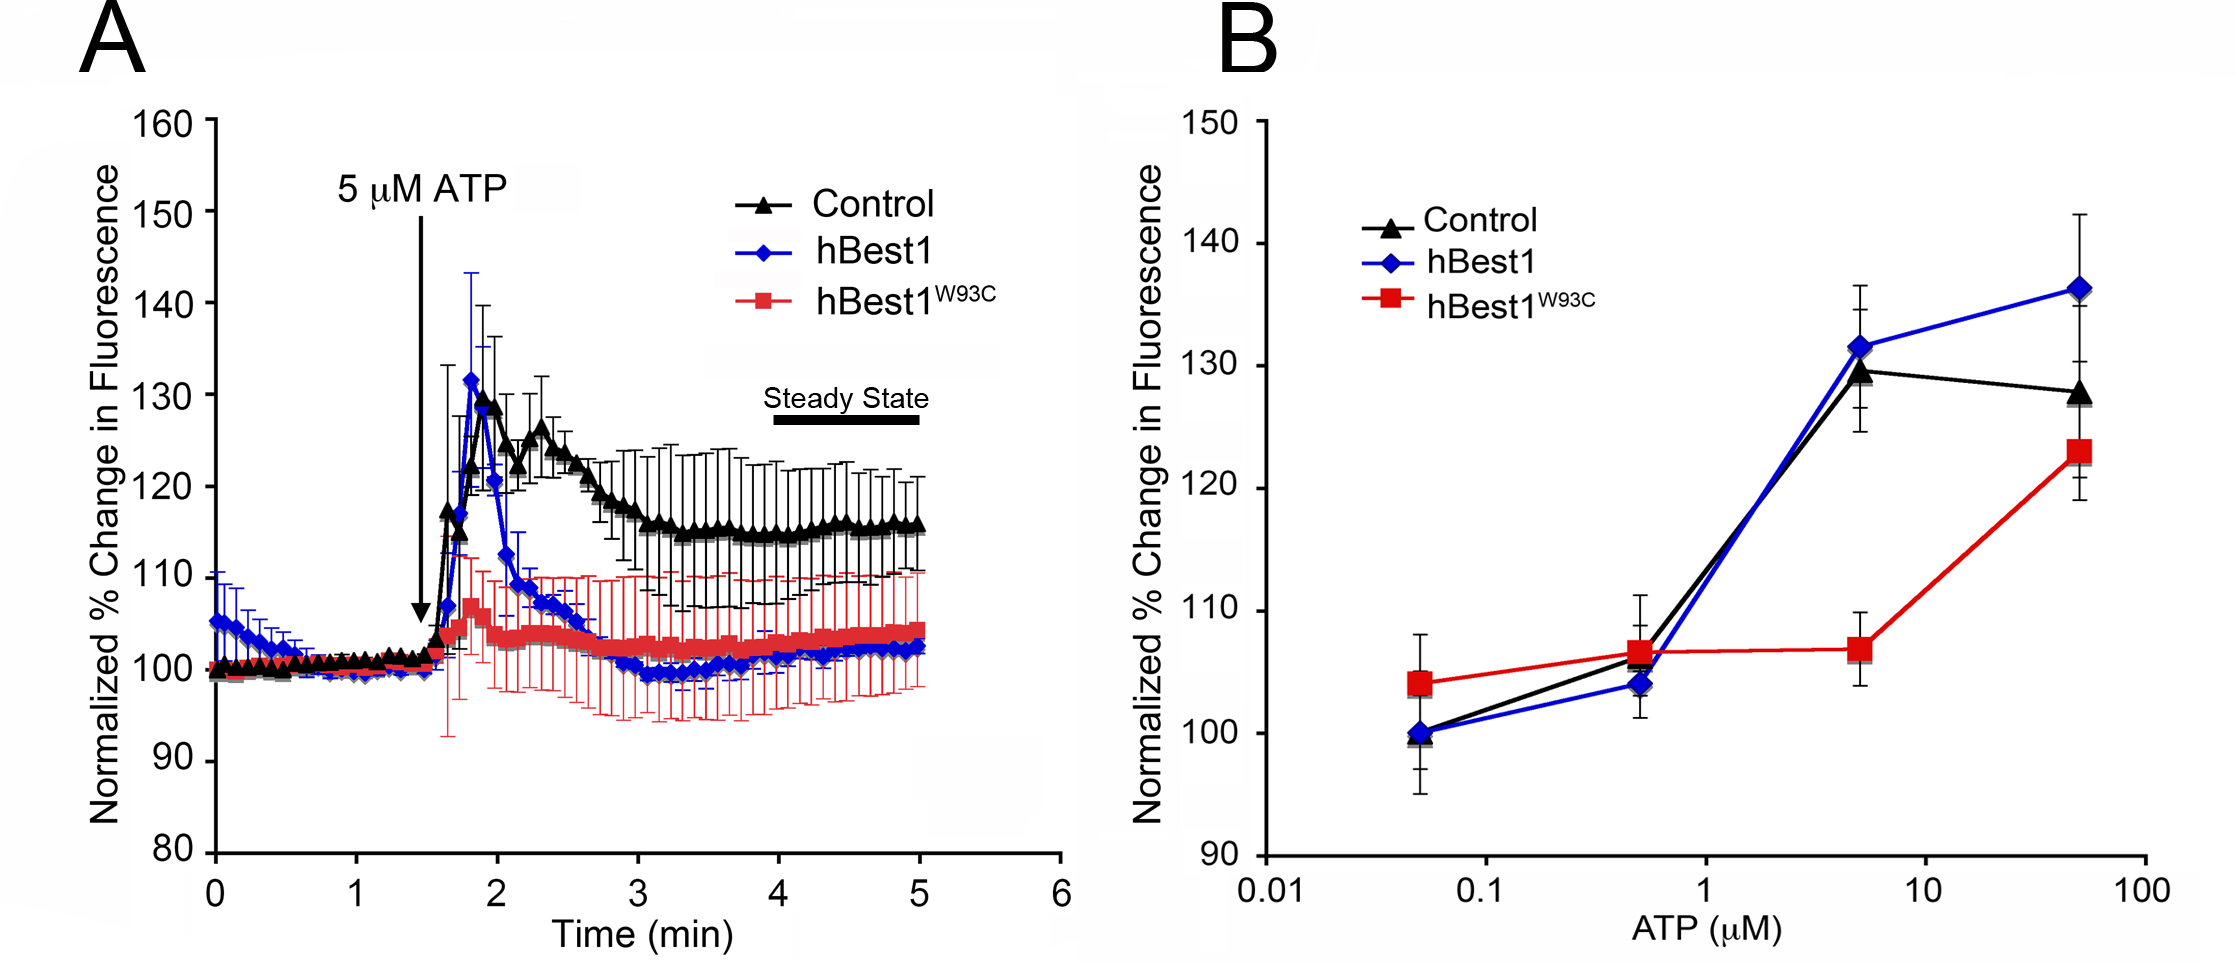
 Figure 7 of
Marmorstein, Mol Vis 2015; 21:347-359.
Figure 7 of
Marmorstein, Mol Vis 2015; 21:347-359.