Figure 6. Effect of hBest1 and hBest1W93C on ATP-induced release of Ca2+ stores. A: The concentration of intracellular Ca2+ was measured using the indicator dye fura-2 in fhRPE following stimulation with 100 µM ATP. [Ca2+]i was compared between control monolayers and monolayers overexpressing hBest1 or hBest1W93C after ATP-stimulation, as well as after subsequent washout of ATP. B: Prior to ATP stimulation, mean baselines [Ca2+]i between control and overexpressing monolayers are shown. Differences between monolayers were significant (p<0.005 versus
controls, n=4). Data are mean ± SEM.
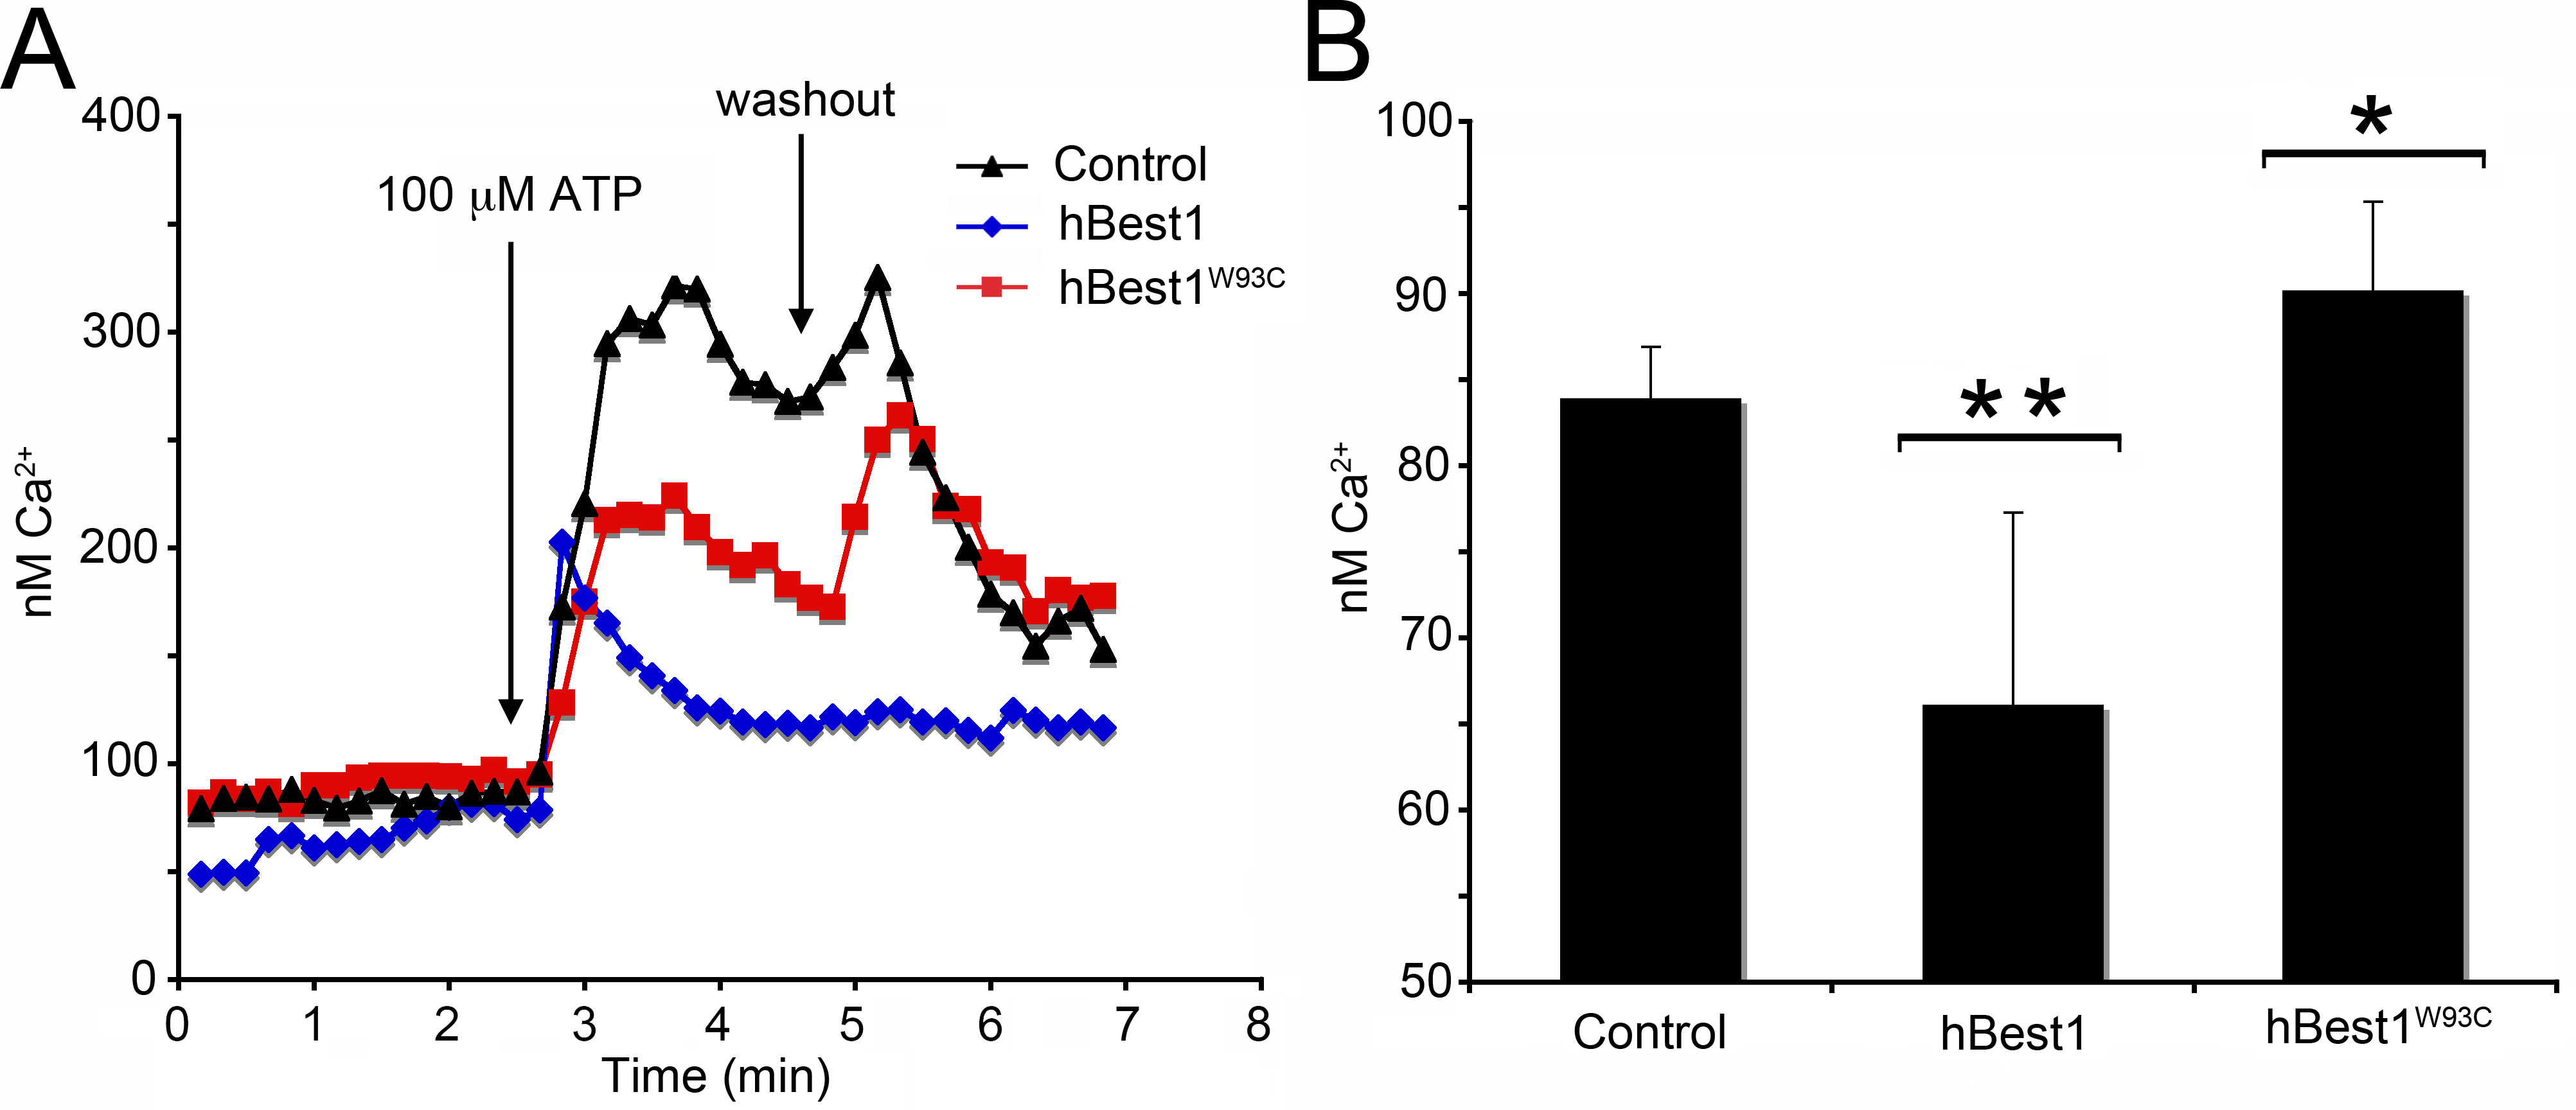
 Figure 6 of
Marmorstein, Mol Vis 2015; 21:347-359.
Figure 6 of
Marmorstein, Mol Vis 2015; 21:347-359.