Figure 3 of
Chi, Mol Vis 2015; 21:335-346.
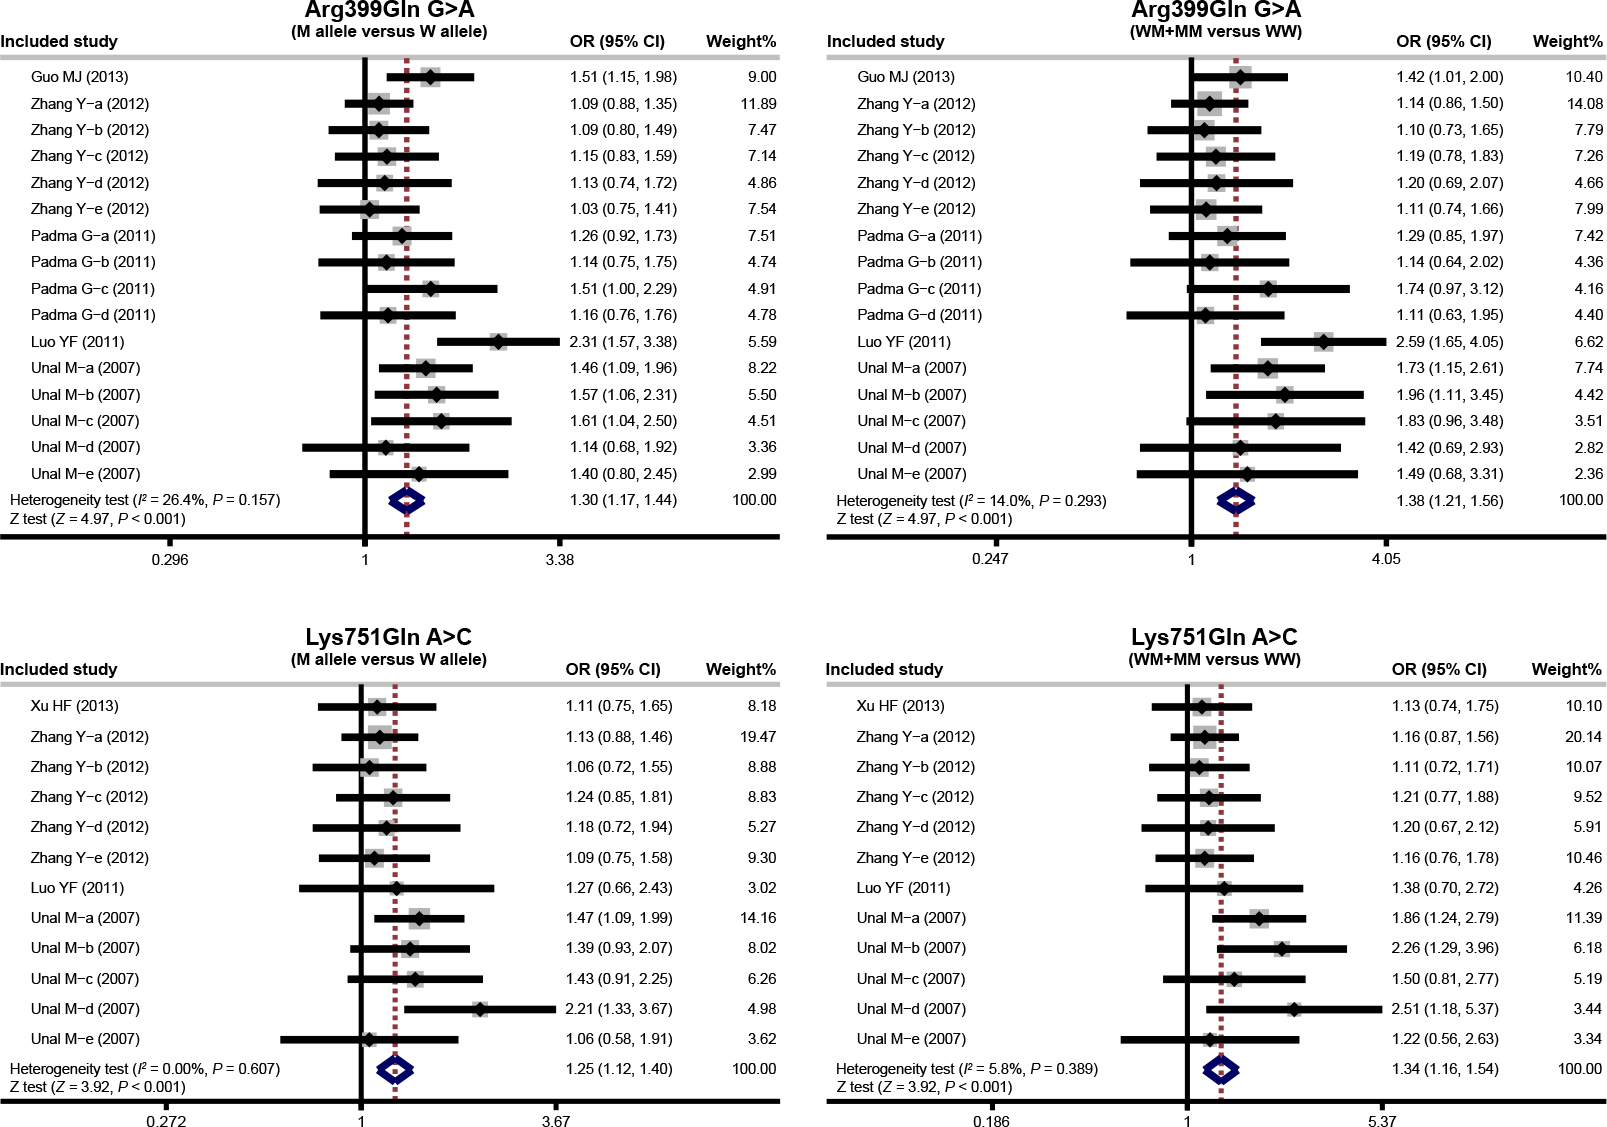
Figure 3.
Forest plots for the relationships of
XRCC1
and
XPD
SNPs with susceptibility to age-related cataract under the allele and dominant models.
 Figure 3 of
Chi, Mol Vis 2015; 21:335-346. Figure 3 of
Chi, Mol Vis 2015; 21:335-346.
Figure 3 of
Chi, Mol Vis 2015; 21:335-346. Figure 3 of
Chi, Mol Vis 2015; 21:335-346.