Figure 2. Effect of miR-21 on the proliferation of orbital fibroblasts from TAO donors (n=3). A: Real-time PCR shows miR-21 expression after different treatments. B: The proliferation of anti-miR-21 and miR-21 mimic transfected cells. C: Western blot analysis of the protein level of Ki67. D: Quantification of the protein band density in panel C. Results are expressed as mean ± standard deviation (SD; *p<0.05 versus control). Data are representative of three independent
experiments.
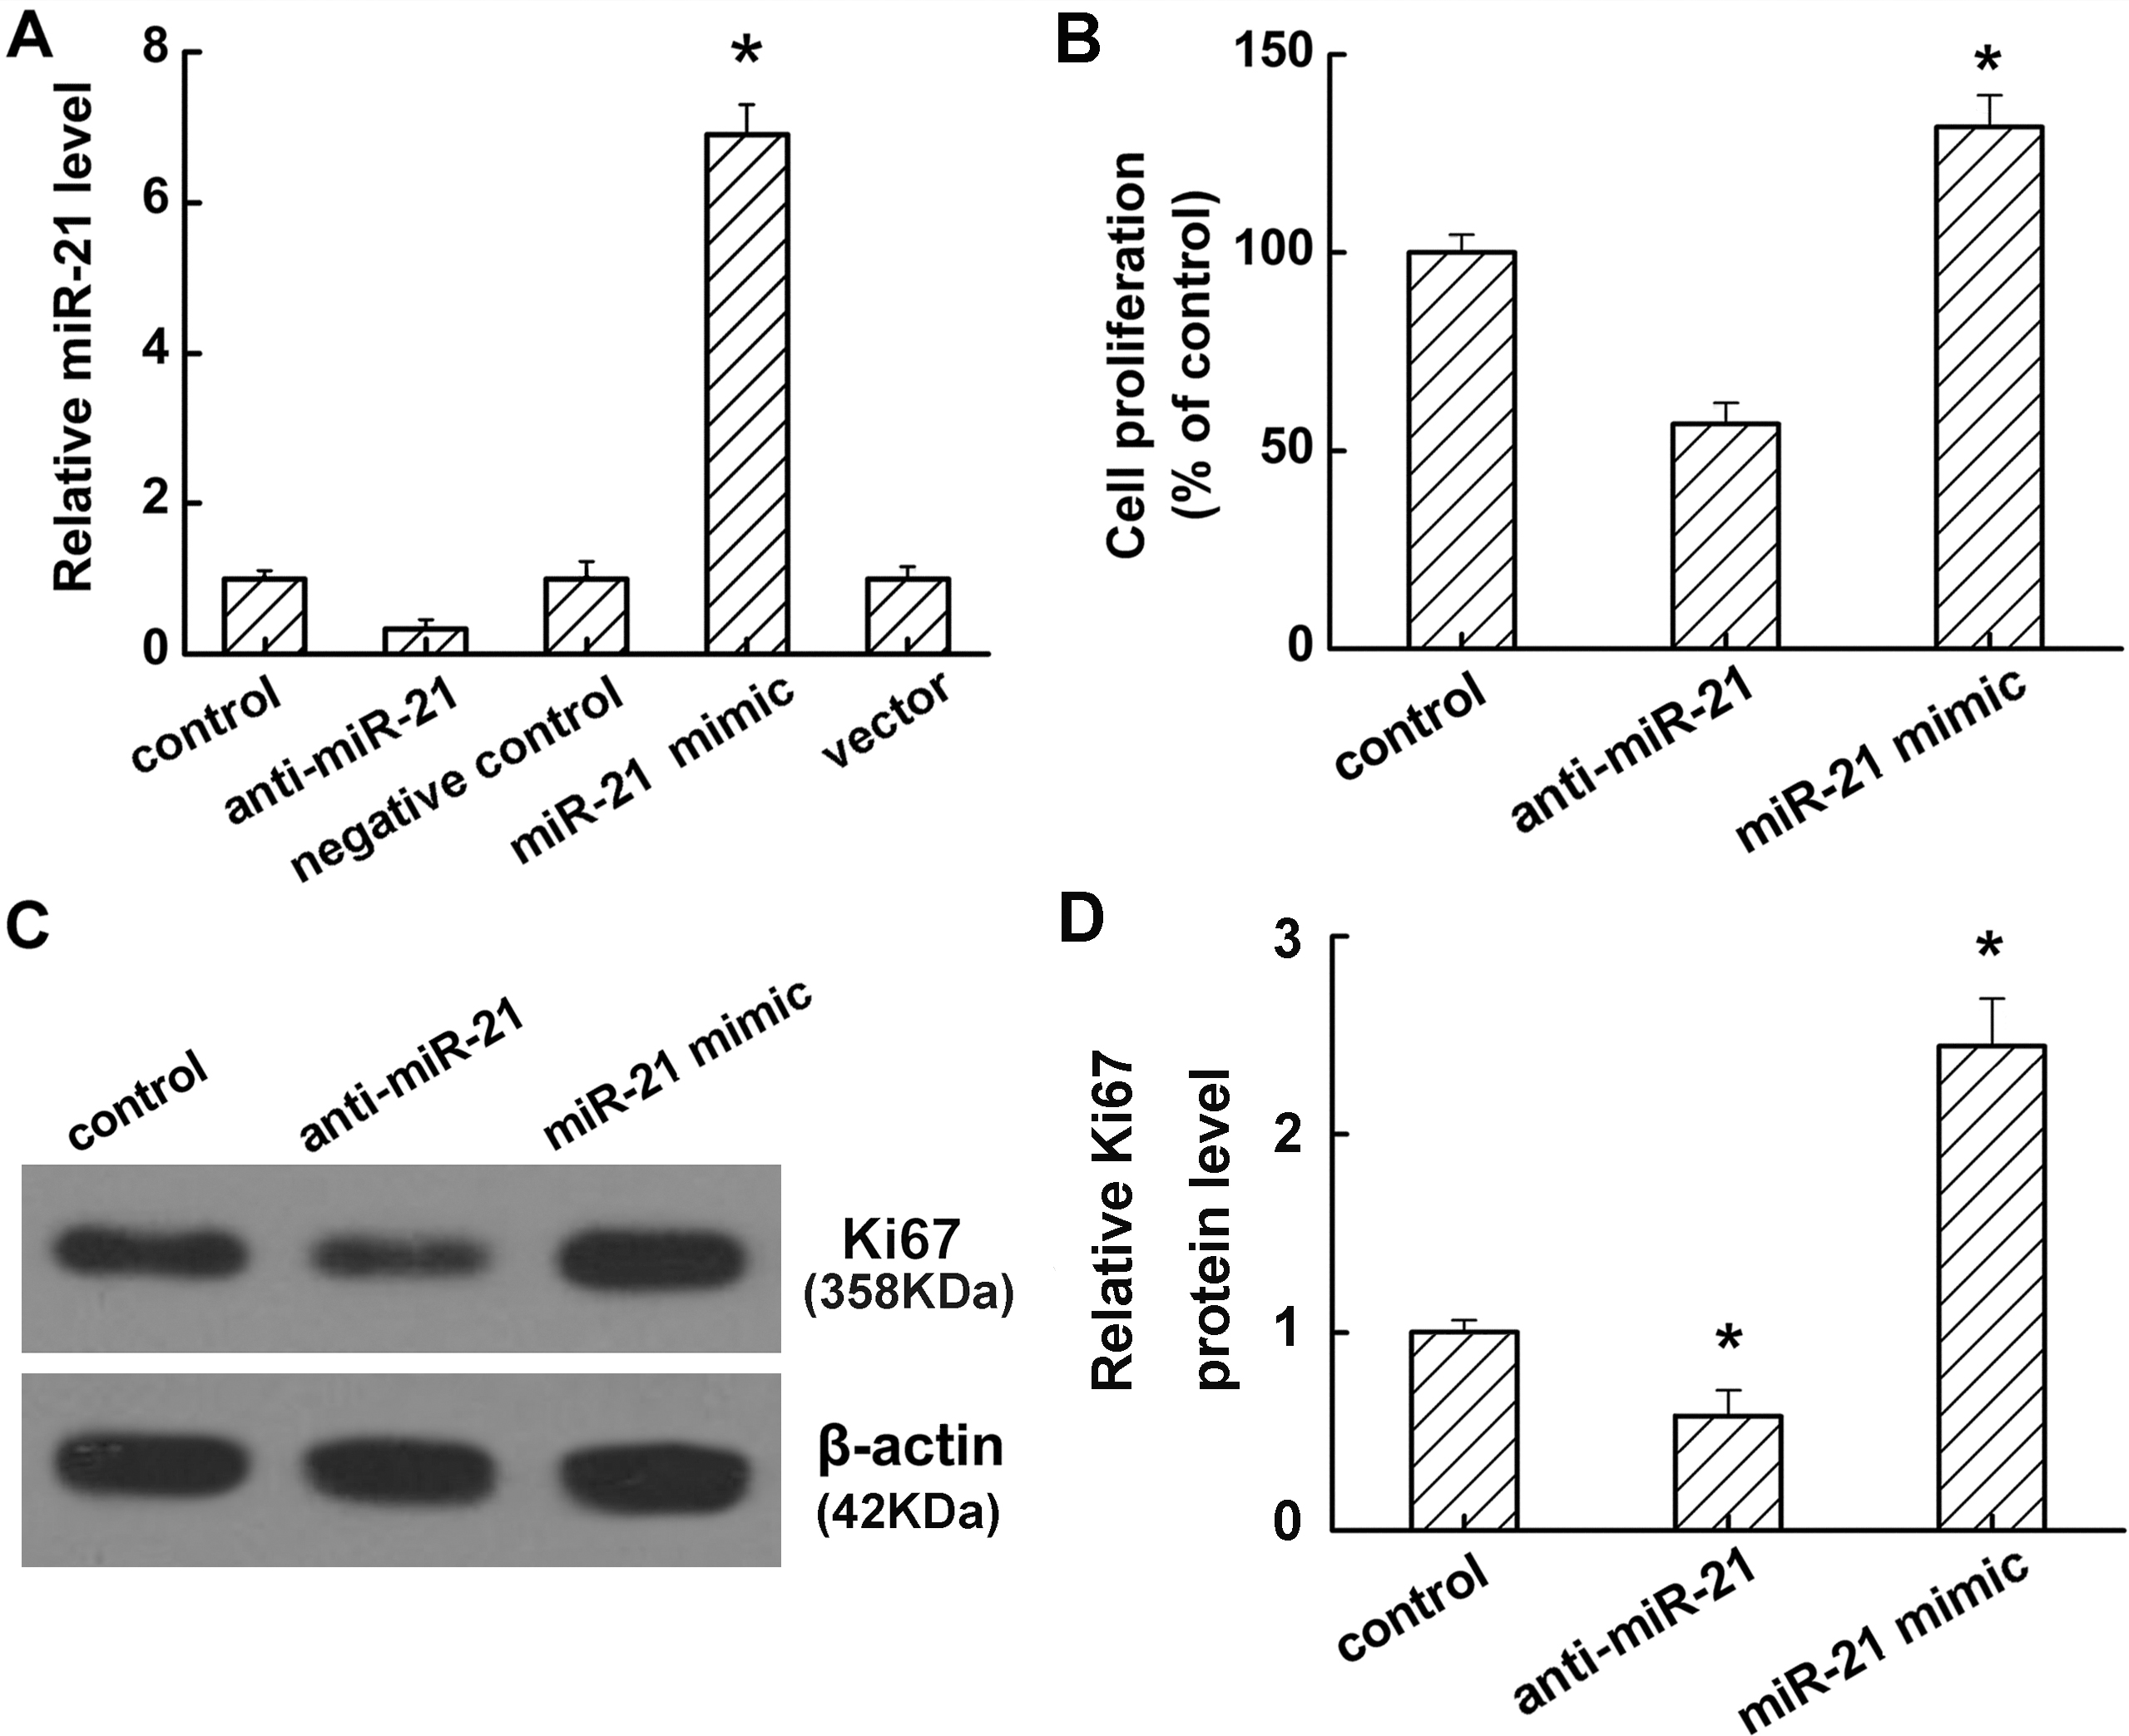
 Figure 2 of
Bo-ding, Mol Vis 2015; 21:324-334.
Figure 2 of
Bo-ding, Mol Vis 2015; 21:324-334.