Figure 4. Segregation analysis of the SPATA7 mutation in family TR 11. Affected members are indicated with filled symbols, and unaffected members are represented by open
symbols. The arrow indicates the index patient. Segregation analysis was performed with all family members as denoted by the
genotype data (underneath). Two distinct PCR amplifications were used to analyze deletion and wild-type alleles, respectively:
(1) one PCR with primers directly flanking the deletion breakpoints (top panel, Del) and (2) one PCR with primers amplifying
exon 2 of SPATA7 located within the deletion (bottom panel, Ex. 2). The latter indicates the presence of the wild-type allele. All PCR products
were analyzed on a 2% agarose gel. According to autosomal recessive inheritance, both parents and both unaffected siblings
are heterozygous, and the two affected sisters are homozygous mutation carriers. Del, deletion allele; +, wild-type allele;
Ex. 2, exon 2 (in place of wild-type allele); M, size marker (KEB, pcDNA 3.1zeo/TaqI-digested, fragment sizes given in bp);
Co, control (DNA of an unaffected, not related person); NC, negative control (water control).
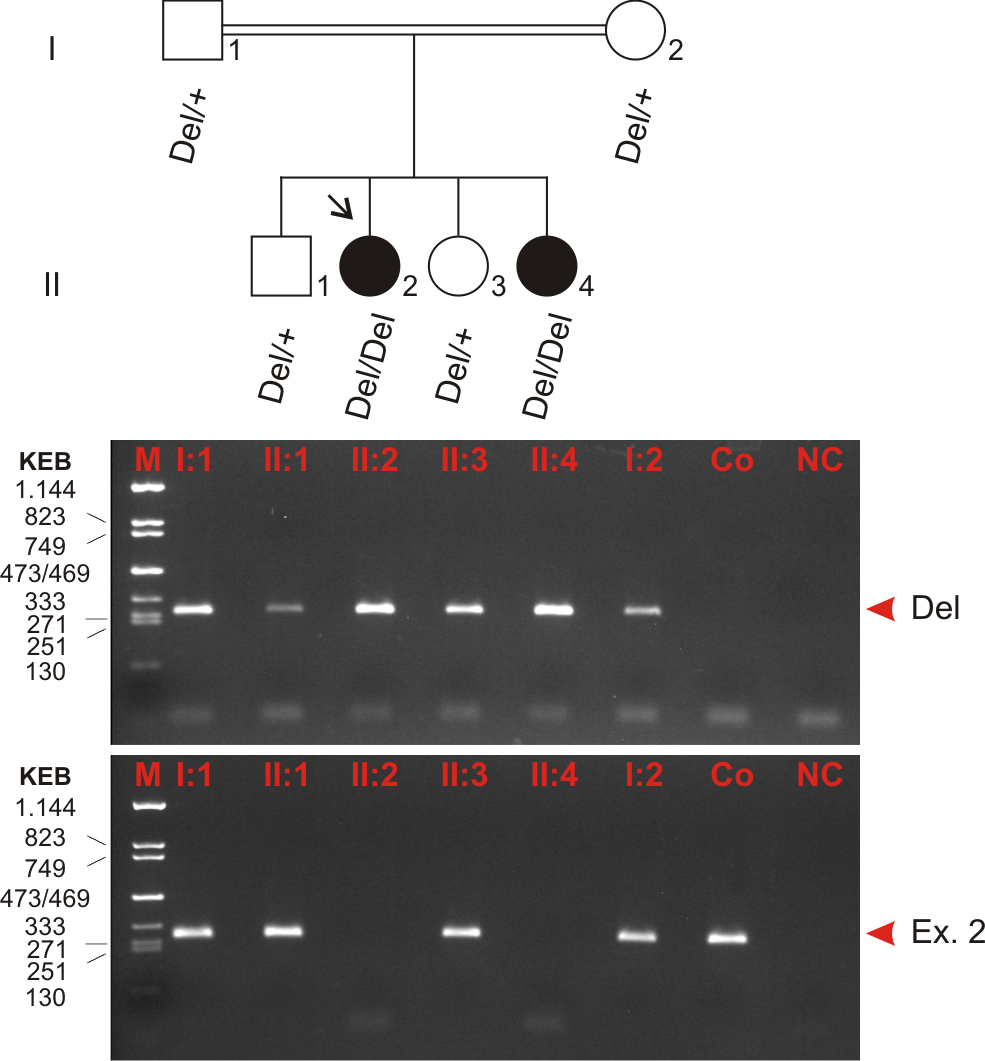
 Figure 4 of
Mayer, Mol Vis 2015; 21:306-315.
Figure 4 of
Mayer, Mol Vis 2015; 21:306-315.