Figure 5. mRNA expression of intrinsic apoptotic factors such as caspase-9 (A) and cytochrome-C (B). β-actin was used as an internal marker. Statistical significance between the control group versus other groups was considered at
the level of p<0.05 using SNK test. a represents the statistical significance Group I versus Group II, and b represents the statistical significance of Group II versus Group III.
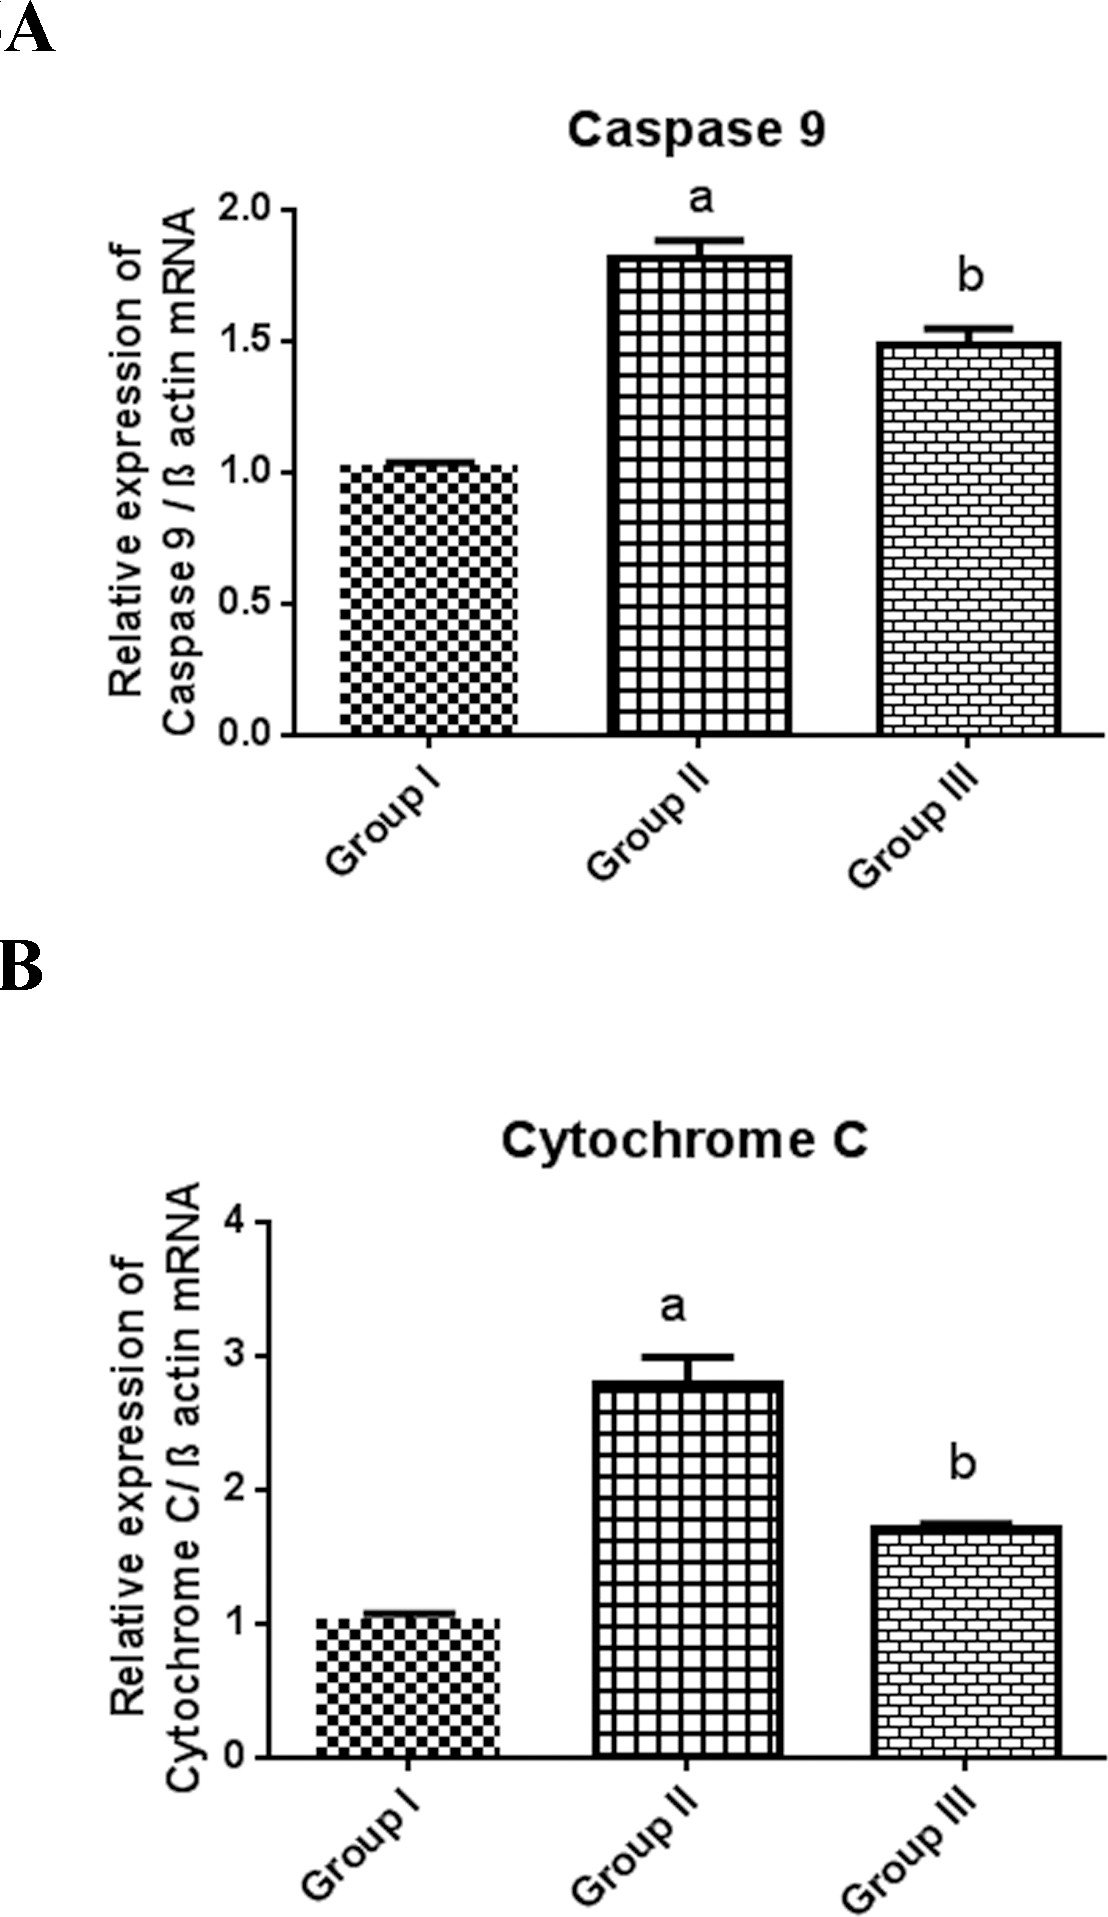
 Figure 5 of
Kumari, Mol Vis 2015; 21:26-39.
Figure 5 of
Kumari, Mol Vis 2015; 21:26-39.