Figure 4. mRNA expression of Bad (A), Bax (B), and Bcl-2 (C) in the eye lens of sodium selenite induced and C-PC treated animals. β-actin was used as an internal marker, and the fluorescent intensity was normalized by the intensity of β-actin. Each bar represents mean ± standard error of the mean (SEM) of three independent observations. Statistical significance
was considered at p<0.05. a Group I versus Group II; b represents Group II versus Group III.
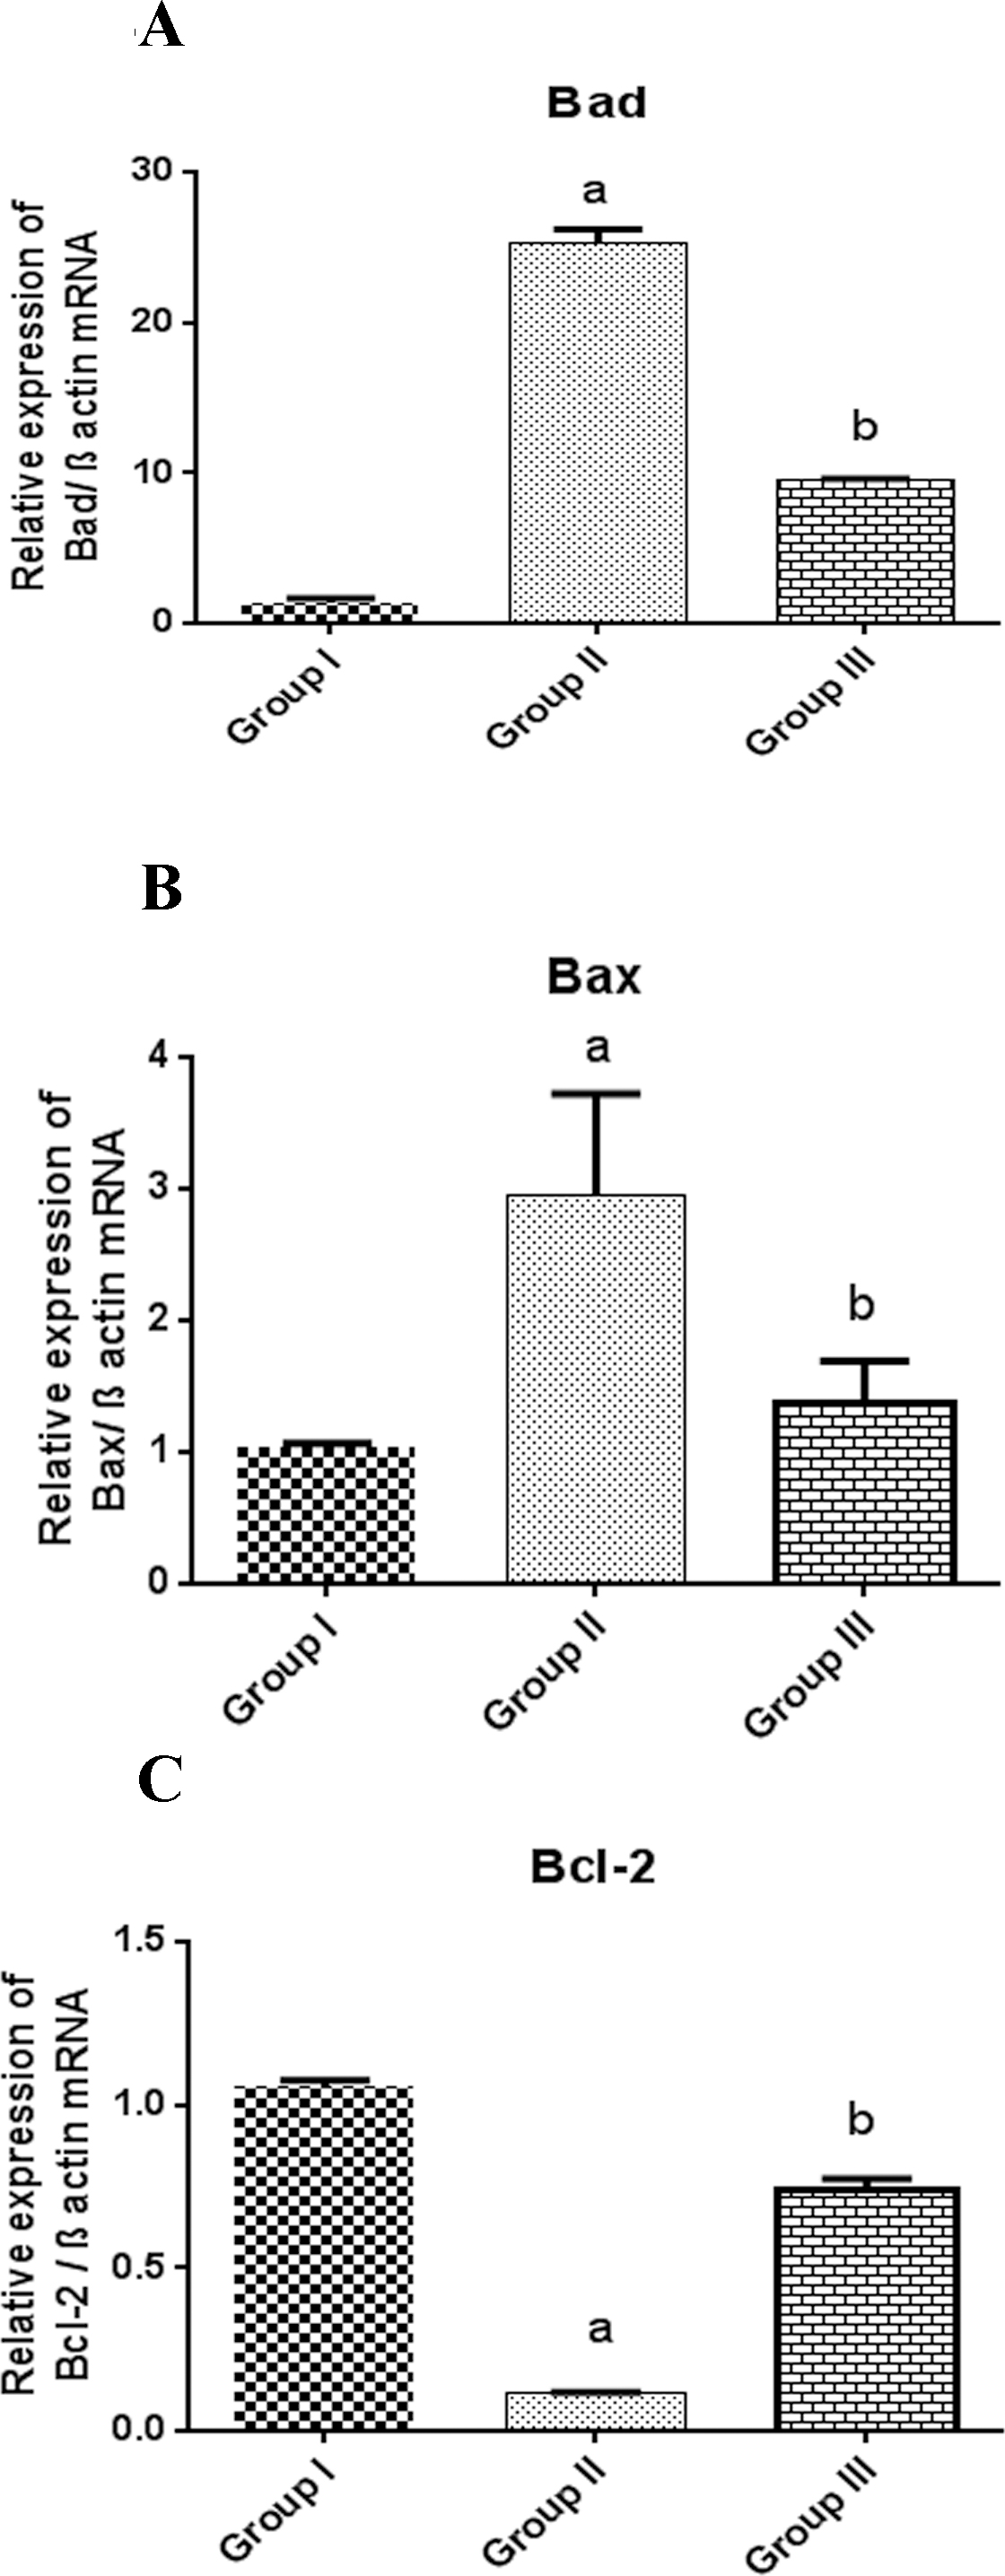
 Figure 4 of
Kumari, Mol Vis 2015; 21:26-39.
Figure 4 of
Kumari, Mol Vis 2015; 21:26-39.