Figure 2. mRNA expression of Cat (A), SOD-1 (B), and Gpx (C) from Group I, II, and III rat lenses. Total RNA was extracted from rat lens tissues, and mRNA levels were measured using
real-time PCR normalized to β-actin and expressed as folds of increases or decreases relative to controls. The data are expressed as mean ± standard error of
the mean (SEM) of three independent observations. Statistical significance between the control group versus the other groups
was considered at the level of p<0.05 using SNK test. a represents the statistical significance Group I versus Group II, and b represents the statistical significance between Group II and Group III.
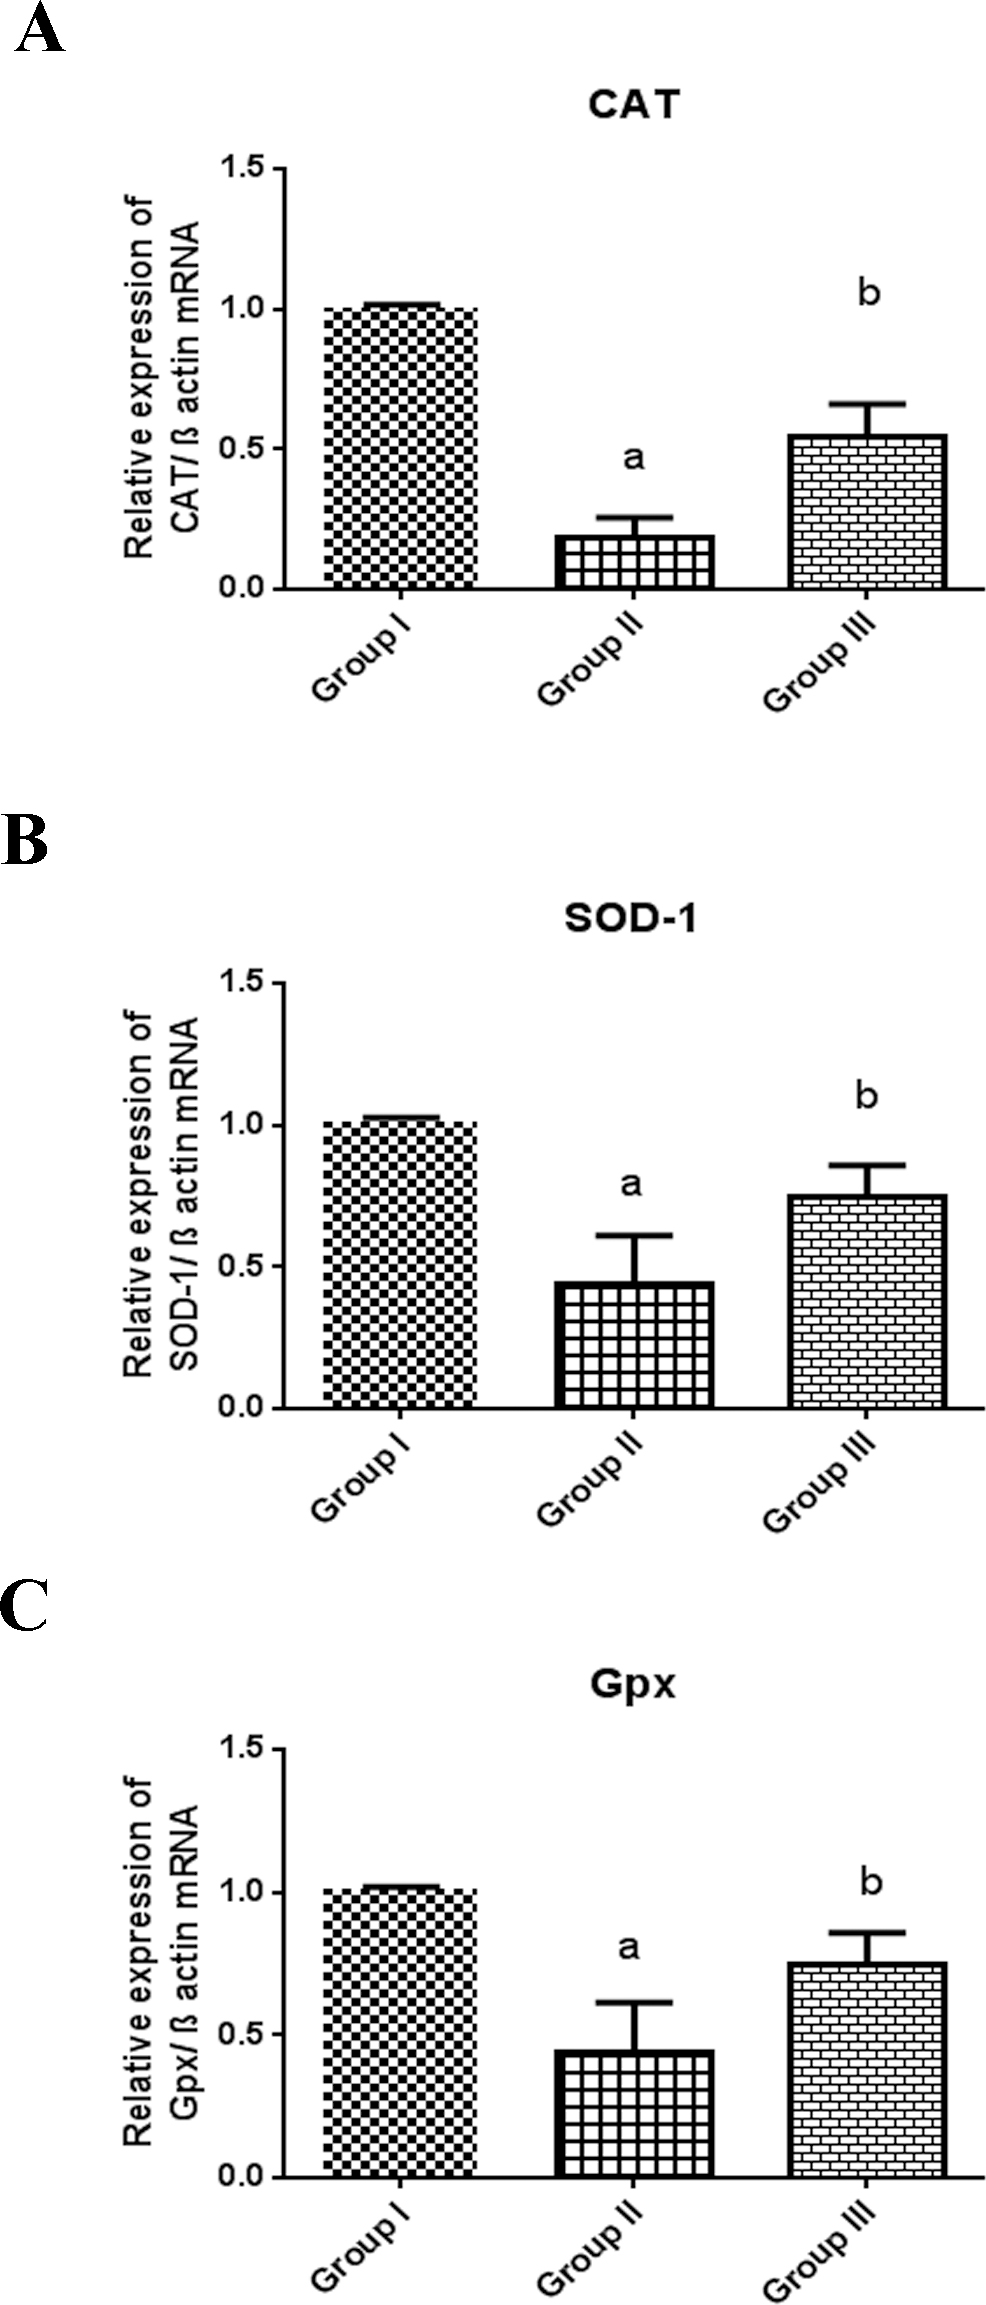
 Figure 2 of
Kumari, Mol Vis 2015; 21:26-39.
Figure 2 of
Kumari, Mol Vis 2015; 21:26-39.