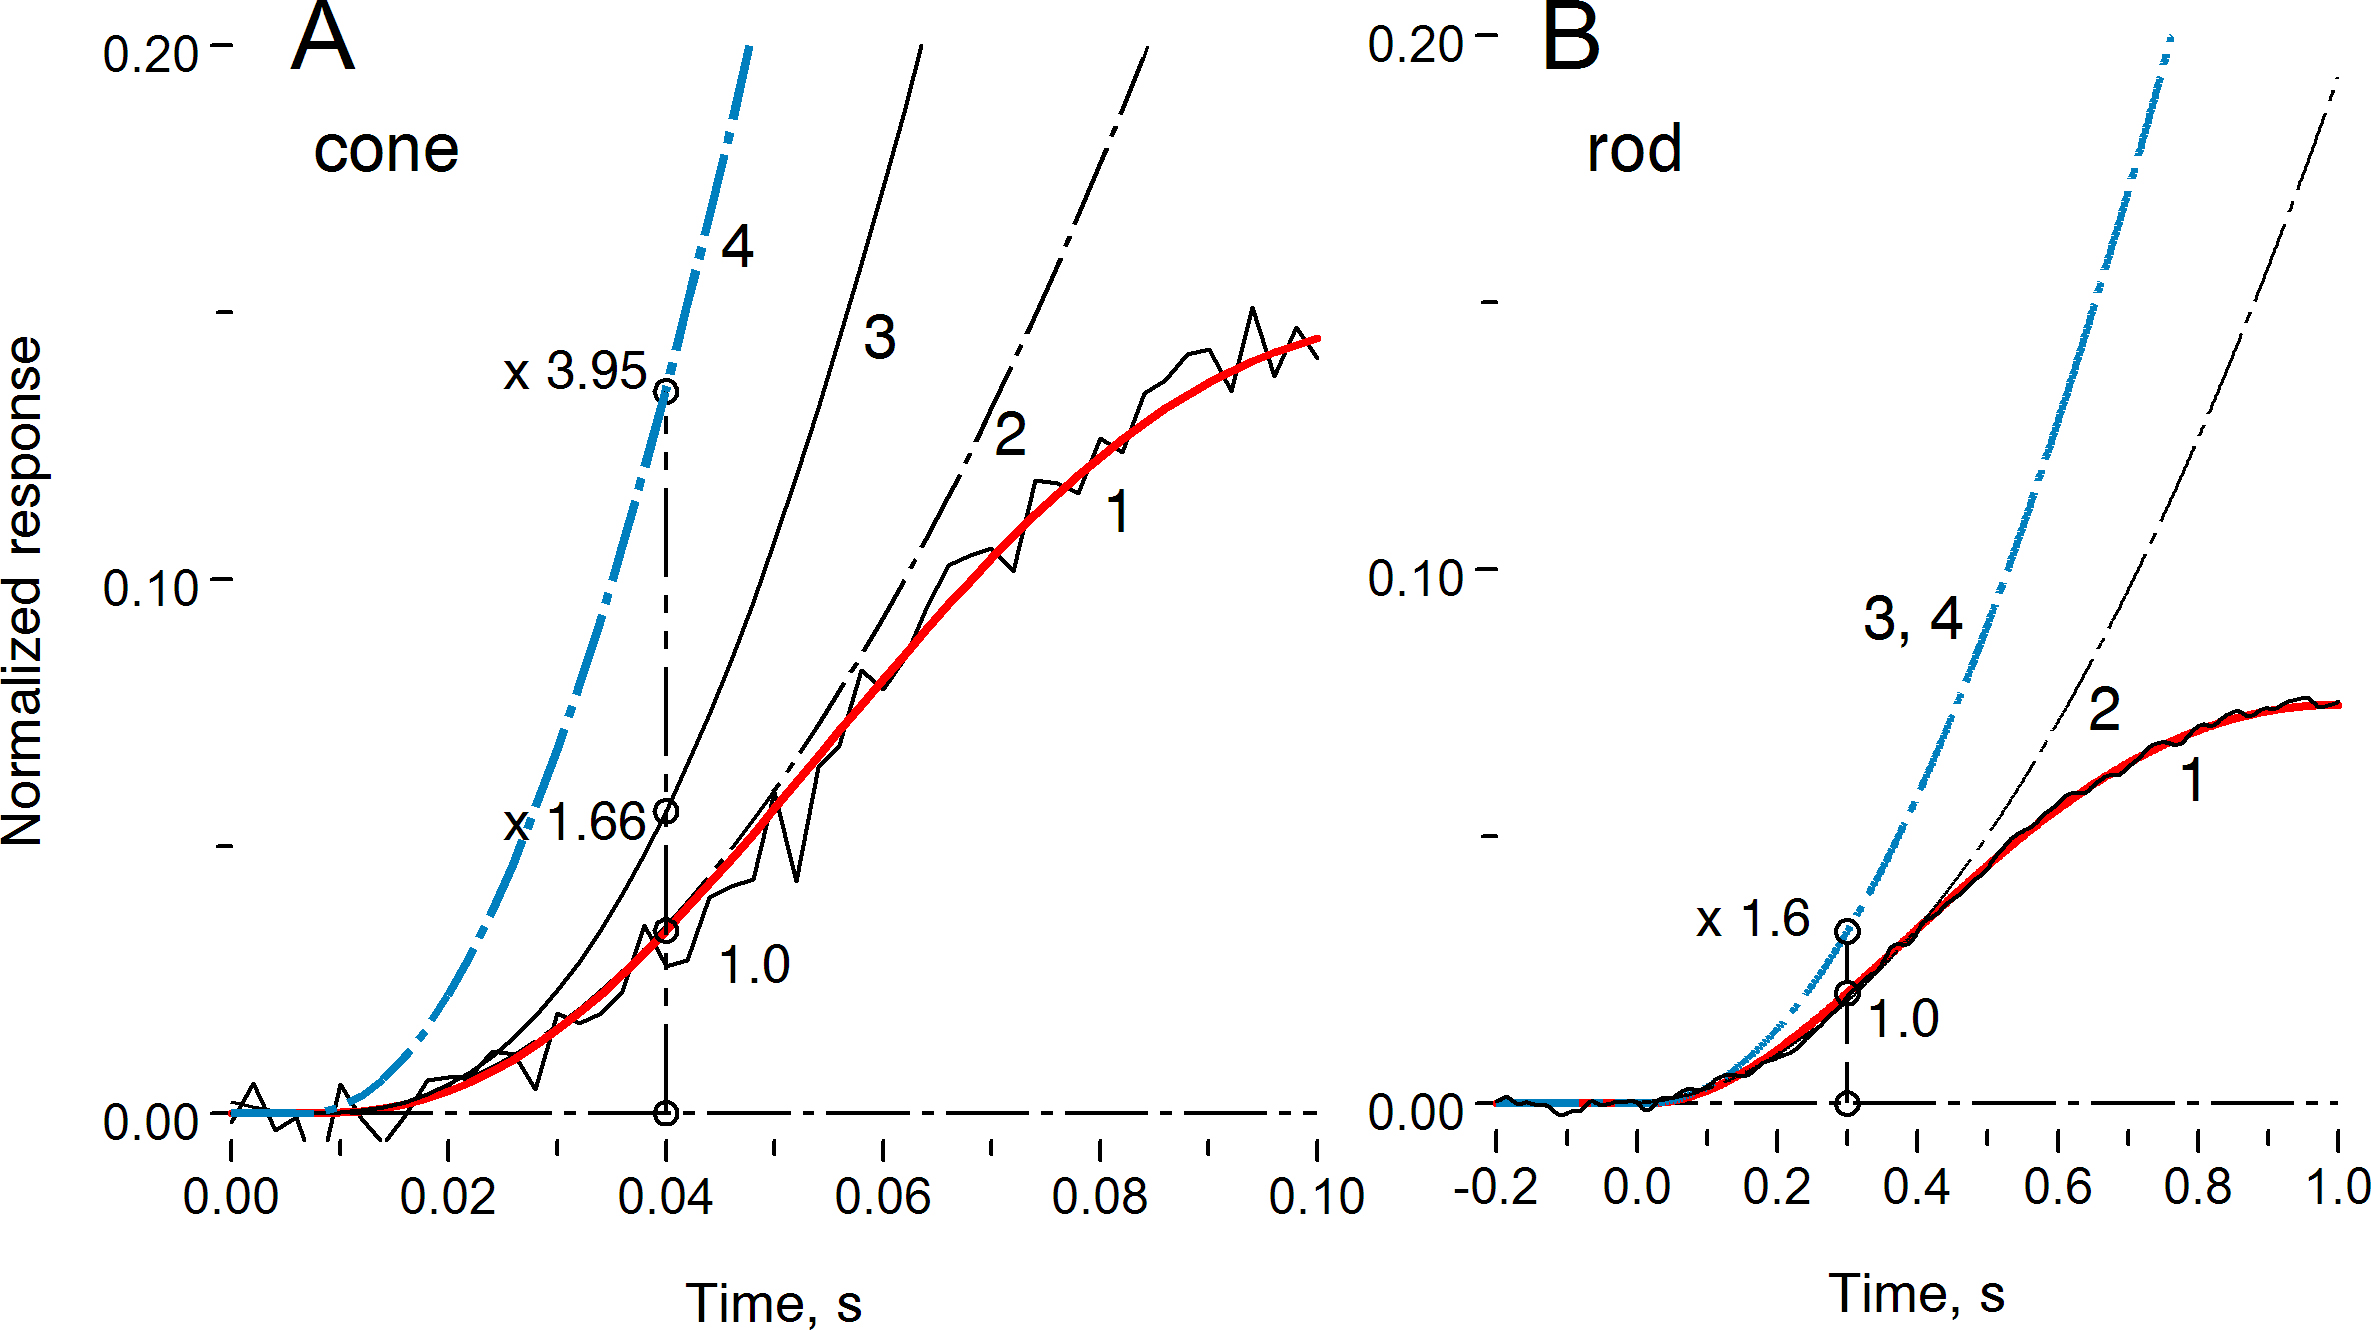
Figure 6. Errors of determining the amplification constant introduced by simplified parabolic fitting of the initial part of the response.
The experimental responses are normalized in a routine way, that is, to the dark current, which consists of the CNG channel
current plus the exchanger current.
A:
Carassius cone. Noisy curve: experimental response of a cone to 2 ms flash applied at time zero; red line 1: the model best fitted
to the entire response; line 2: least-square fit to the initial 40 ms part of the response with the routinely used Pugh and
Lamb [
15,
45,
46] parabola (Equation (2)); line 3: the response of the model in which all turnoff processes and Ca
2+ feedback are disabled, and the model response is normalized to the dark CNG-channel current alone (excluding the exchanger
current); line 4: same as line 3, but in addition, the cell time constant is set to zero. Curve 4 represents the “real” parabola
behind the experimental response; it yields an amplification value that is four times higher than would be derived from routine
fitting (curve 2).
B: Same as A, but for a frog rod. Curves 3 and 4 coincide because the effect of membrane filtering in rods is negligible. Routine
parabolic fitting results in a 1.6-fold underestimate of amplification.
 Figure 6 of
Astakhova, Mol Vis 2015; 21:244-263.
Figure 6 of
Astakhova, Mol Vis 2015; 21:244-263.