Figure 5. Parameters of Ca2+ turnover in cones derived from the model. A: Average time course of the decay of free Ca2+ concentration after instantaneous closure of the CNG channels. Mean of 16 cells ± standard error of the mean (SEM). The red
line is a two-exponential approximation of average data, with relative amplitudes of 0.694 and 0.306, and time constants of
51 ms and 1.57 s, respectively. B: Correlation of the buffering power of the fast Ca2+ buffer (FB) with the cone’s dark current. Circles mark individual cells. The straight line is a least-square linear fit to data forced
to pass through zero. The red cross marks an (imaginary) cone whose dark current and FB value correspond to the average of the population. C: Effect of FB value on the shape of the model response. The solid smooth line over the noisy curve shows the best-fitting model, FB = 43. Dot-dashed line: model response with FB = 11; smooth red line: model response with FB = 86.
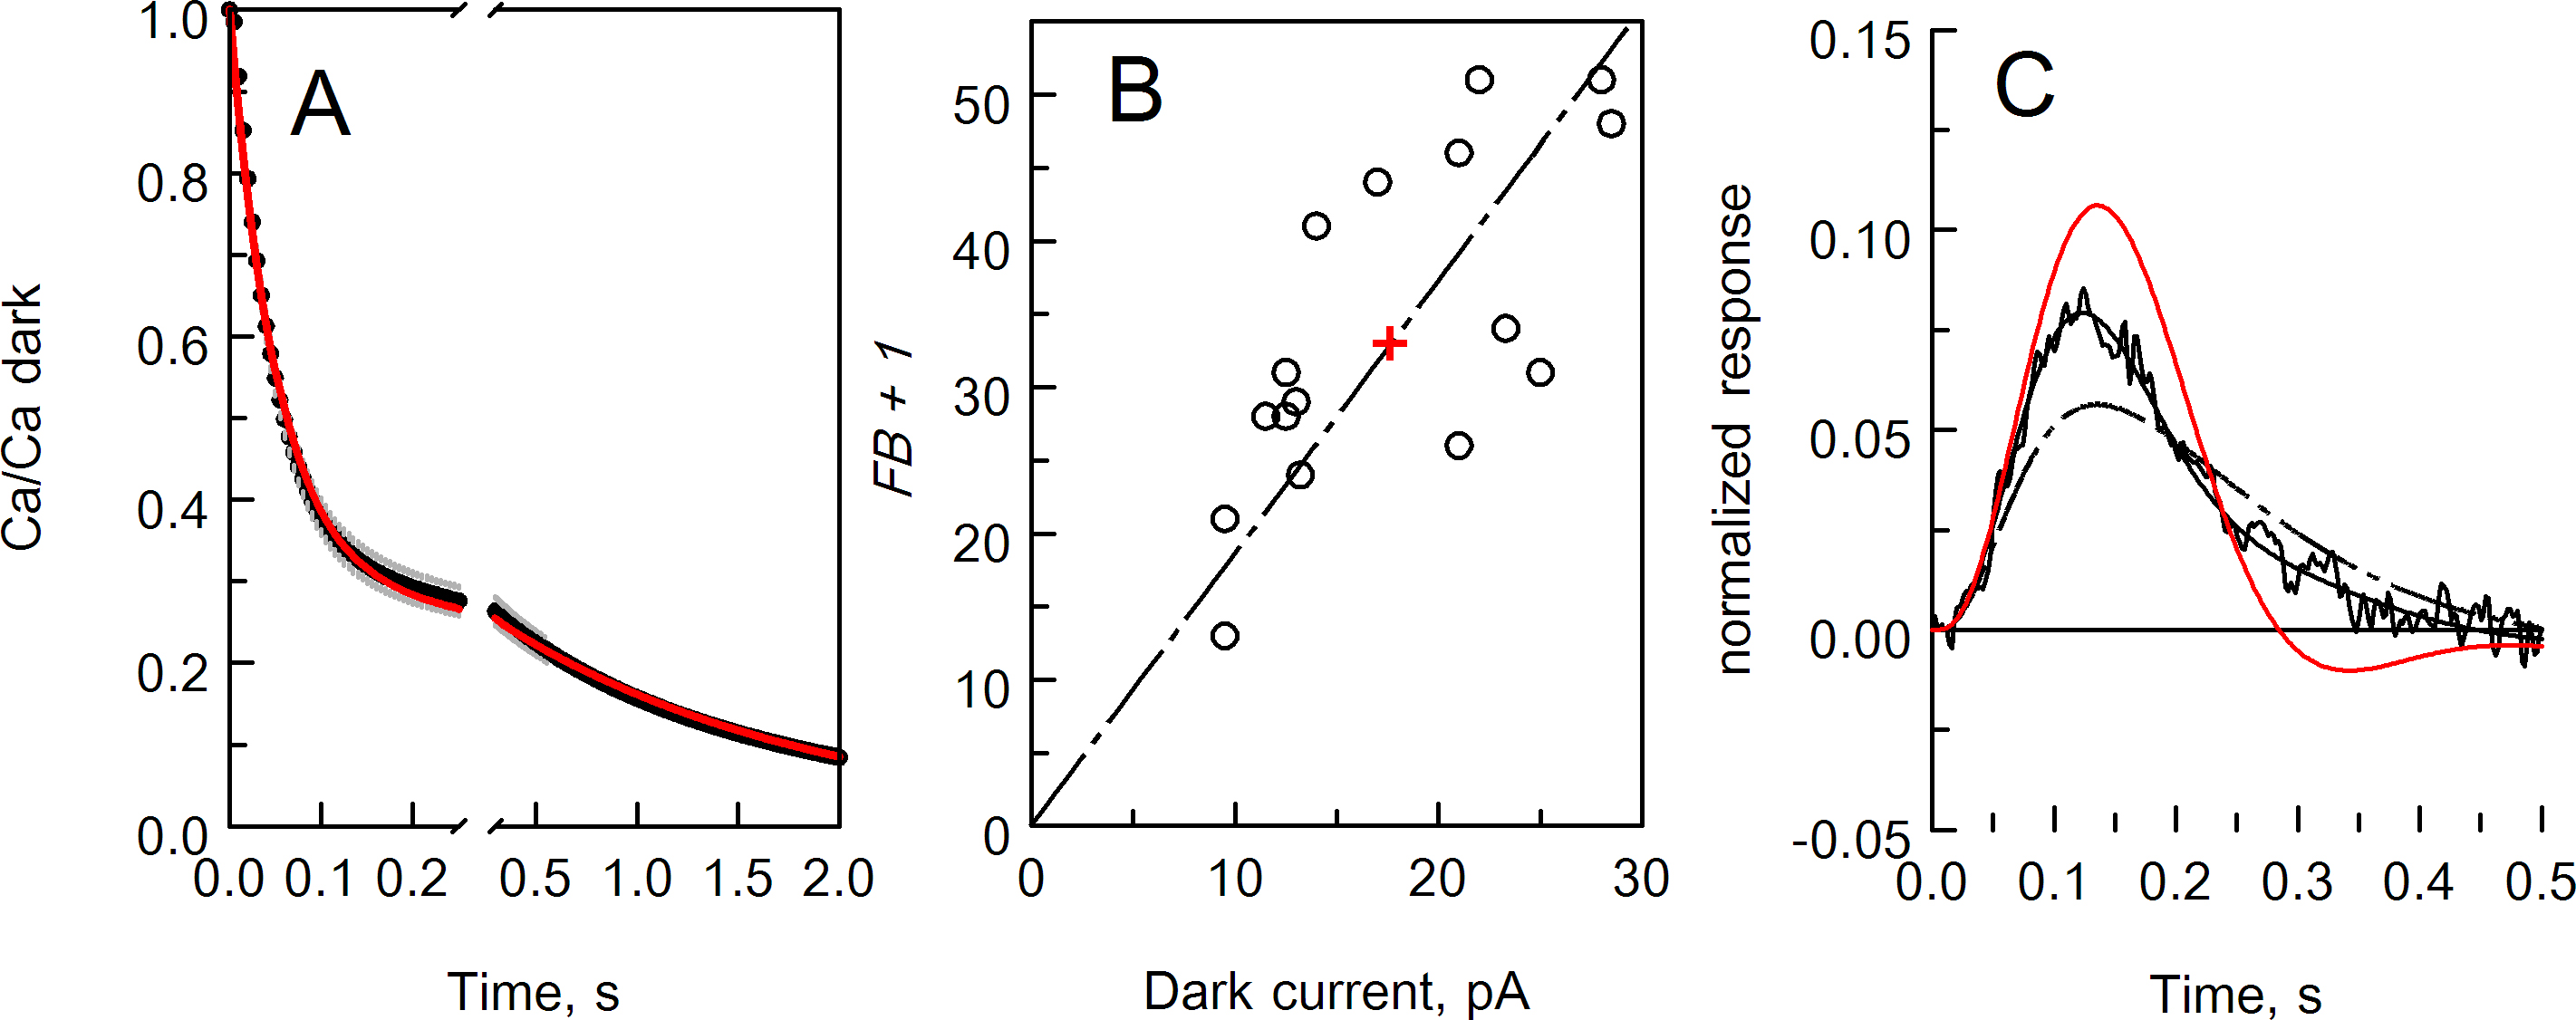
 Figure 5 of
Astakhova, Mol Vis 2015; 21:244-263.
Figure 5 of
Astakhova, Mol Vis 2015; 21:244-263.