Figure 4. Testing the validity of the cascade turnoff parameters derived from Ca2+-clamped responses, as described in Appendix 1. A: A cone flash response (noisy curve) fitted with the model whose key parameters were roughly restrained by average Ca2+-clamp data (smooth curve). B: The red line shows light-induced PDE activity βl(t) derived from the model in A. The gray noisy line is βl(t) derived from Ca2+-clamped response of the same cone to an identical flash. The curve is Gauss-filtered with a 20 ms window. A smooth black
line shows the least-square fit to the gray curve with Equation (15), where A=634 s−1, τ1=0.093 s, and τ2=0.084 s. The fit is in a fair agreement with the model-derived curve.
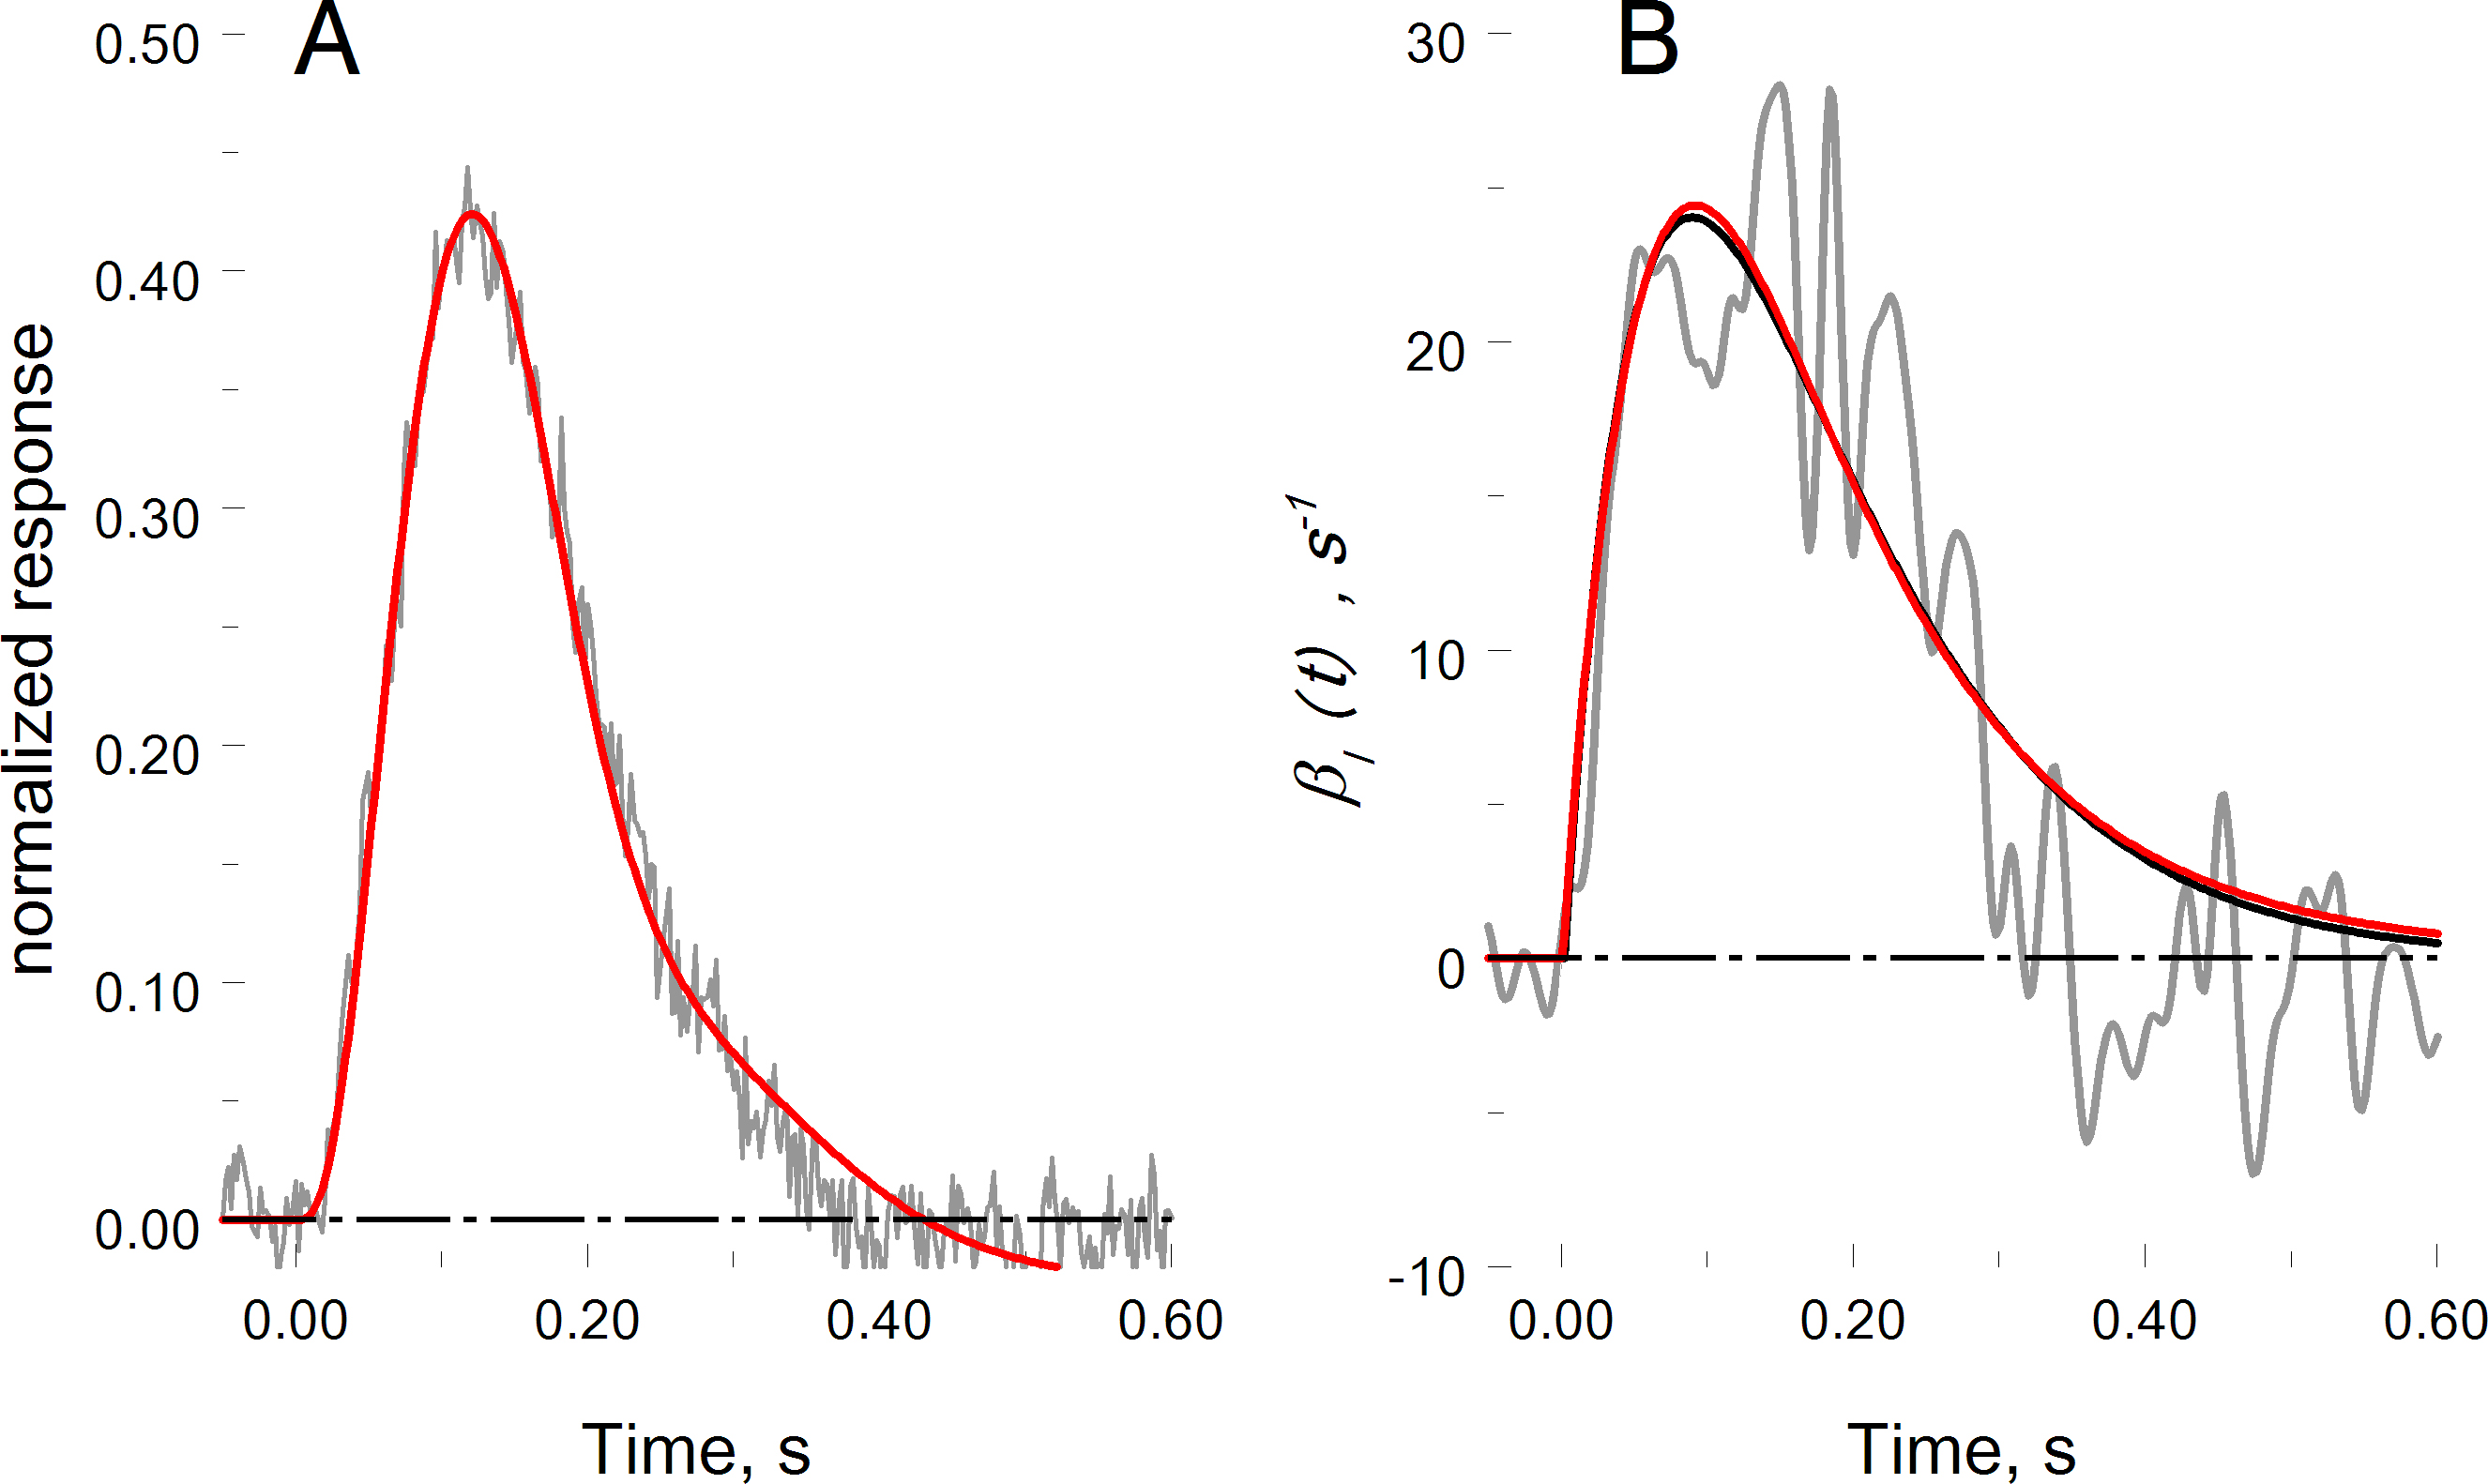
 Figure 4 of
Astakhova, Mol Vis 2015; 21:244-263.
Figure 4 of
Astakhova, Mol Vis 2015; 21:244-263.