Figure 6. Effect of miR-152 mimics on HG-induced VEGF and TGFβ1 expressions in hRECs. Perindopril-treated cells were transfected with
20 nM of control mimics, miR-152 mimics, or miR-152 mimics + 50 nM miR-152 antagomirs for 24 h, as well as exposed to HG for
48 h. Cells were harvested for total mRNA, and transcripts were measured by qRT-PCR. The levels of each transcript were normalized
to that of the internal control Hprt. The ratio was then normalized to that of scramble control and was plotted as a percentage
of control. n = 4, mean ± SEM *p<0.05, **p<0.001 versus control; §p<0.001 versus miR-152 mimics; #p = 0.002 versus mimics.
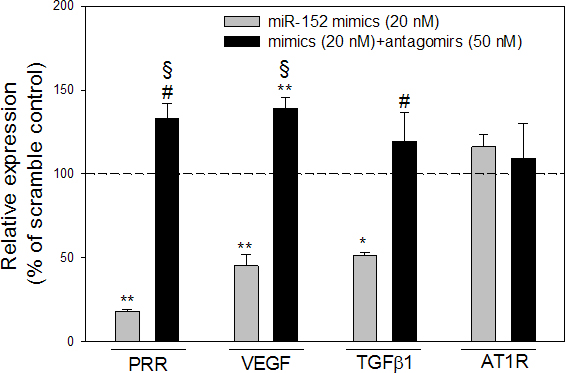
 Figure 6 of
Haque, Mol Vis 2015; 21:224-235.
Figure 6 of
Haque, Mol Vis 2015; 21:224-235.