Figure 5. Effect of HG on the expressions of miR-152 and PRR in hRECs and rat retinal tissues. Hyperglycemic cells or retinal tissues
were processed for total RNA/miRNA extraction (A) and mRNA (B) were measured by qRT-PCR. The expressions of miRNA and mRNA were normalized to those of the internal controls snRNA U6 (A) and Hprt (B), respectively. The miRNA/mRNA levels of the samples treated as controls were arbitrarily set at 1. n = 3–4, mean ± SEM.
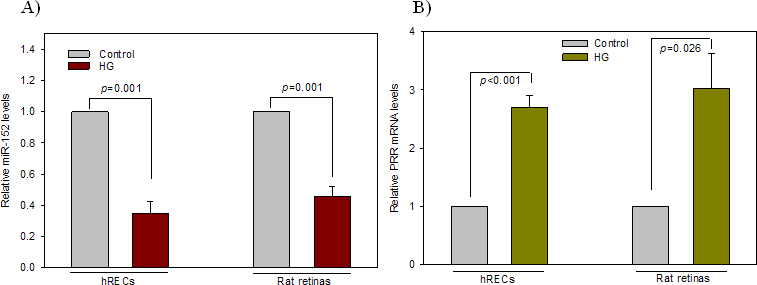
 Figure 5 of
Haque, Mol Vis 2015; 21:224-235.
Figure 5 of
Haque, Mol Vis 2015; 21:224-235.