Figure 2. Four pedigree charts and a haplotype diagram of the recruited families. A: Pedigree chart of the four families and the co-segregation analysis of the families with the c.529–530delGCinsAT and c.335T>C
mutations. B: Family structure and haplotype diagram of the family with the c.529–530delGCinsAT mutation. Solid squares represent the
affected family members, and blackened bars indicate disease alleles.
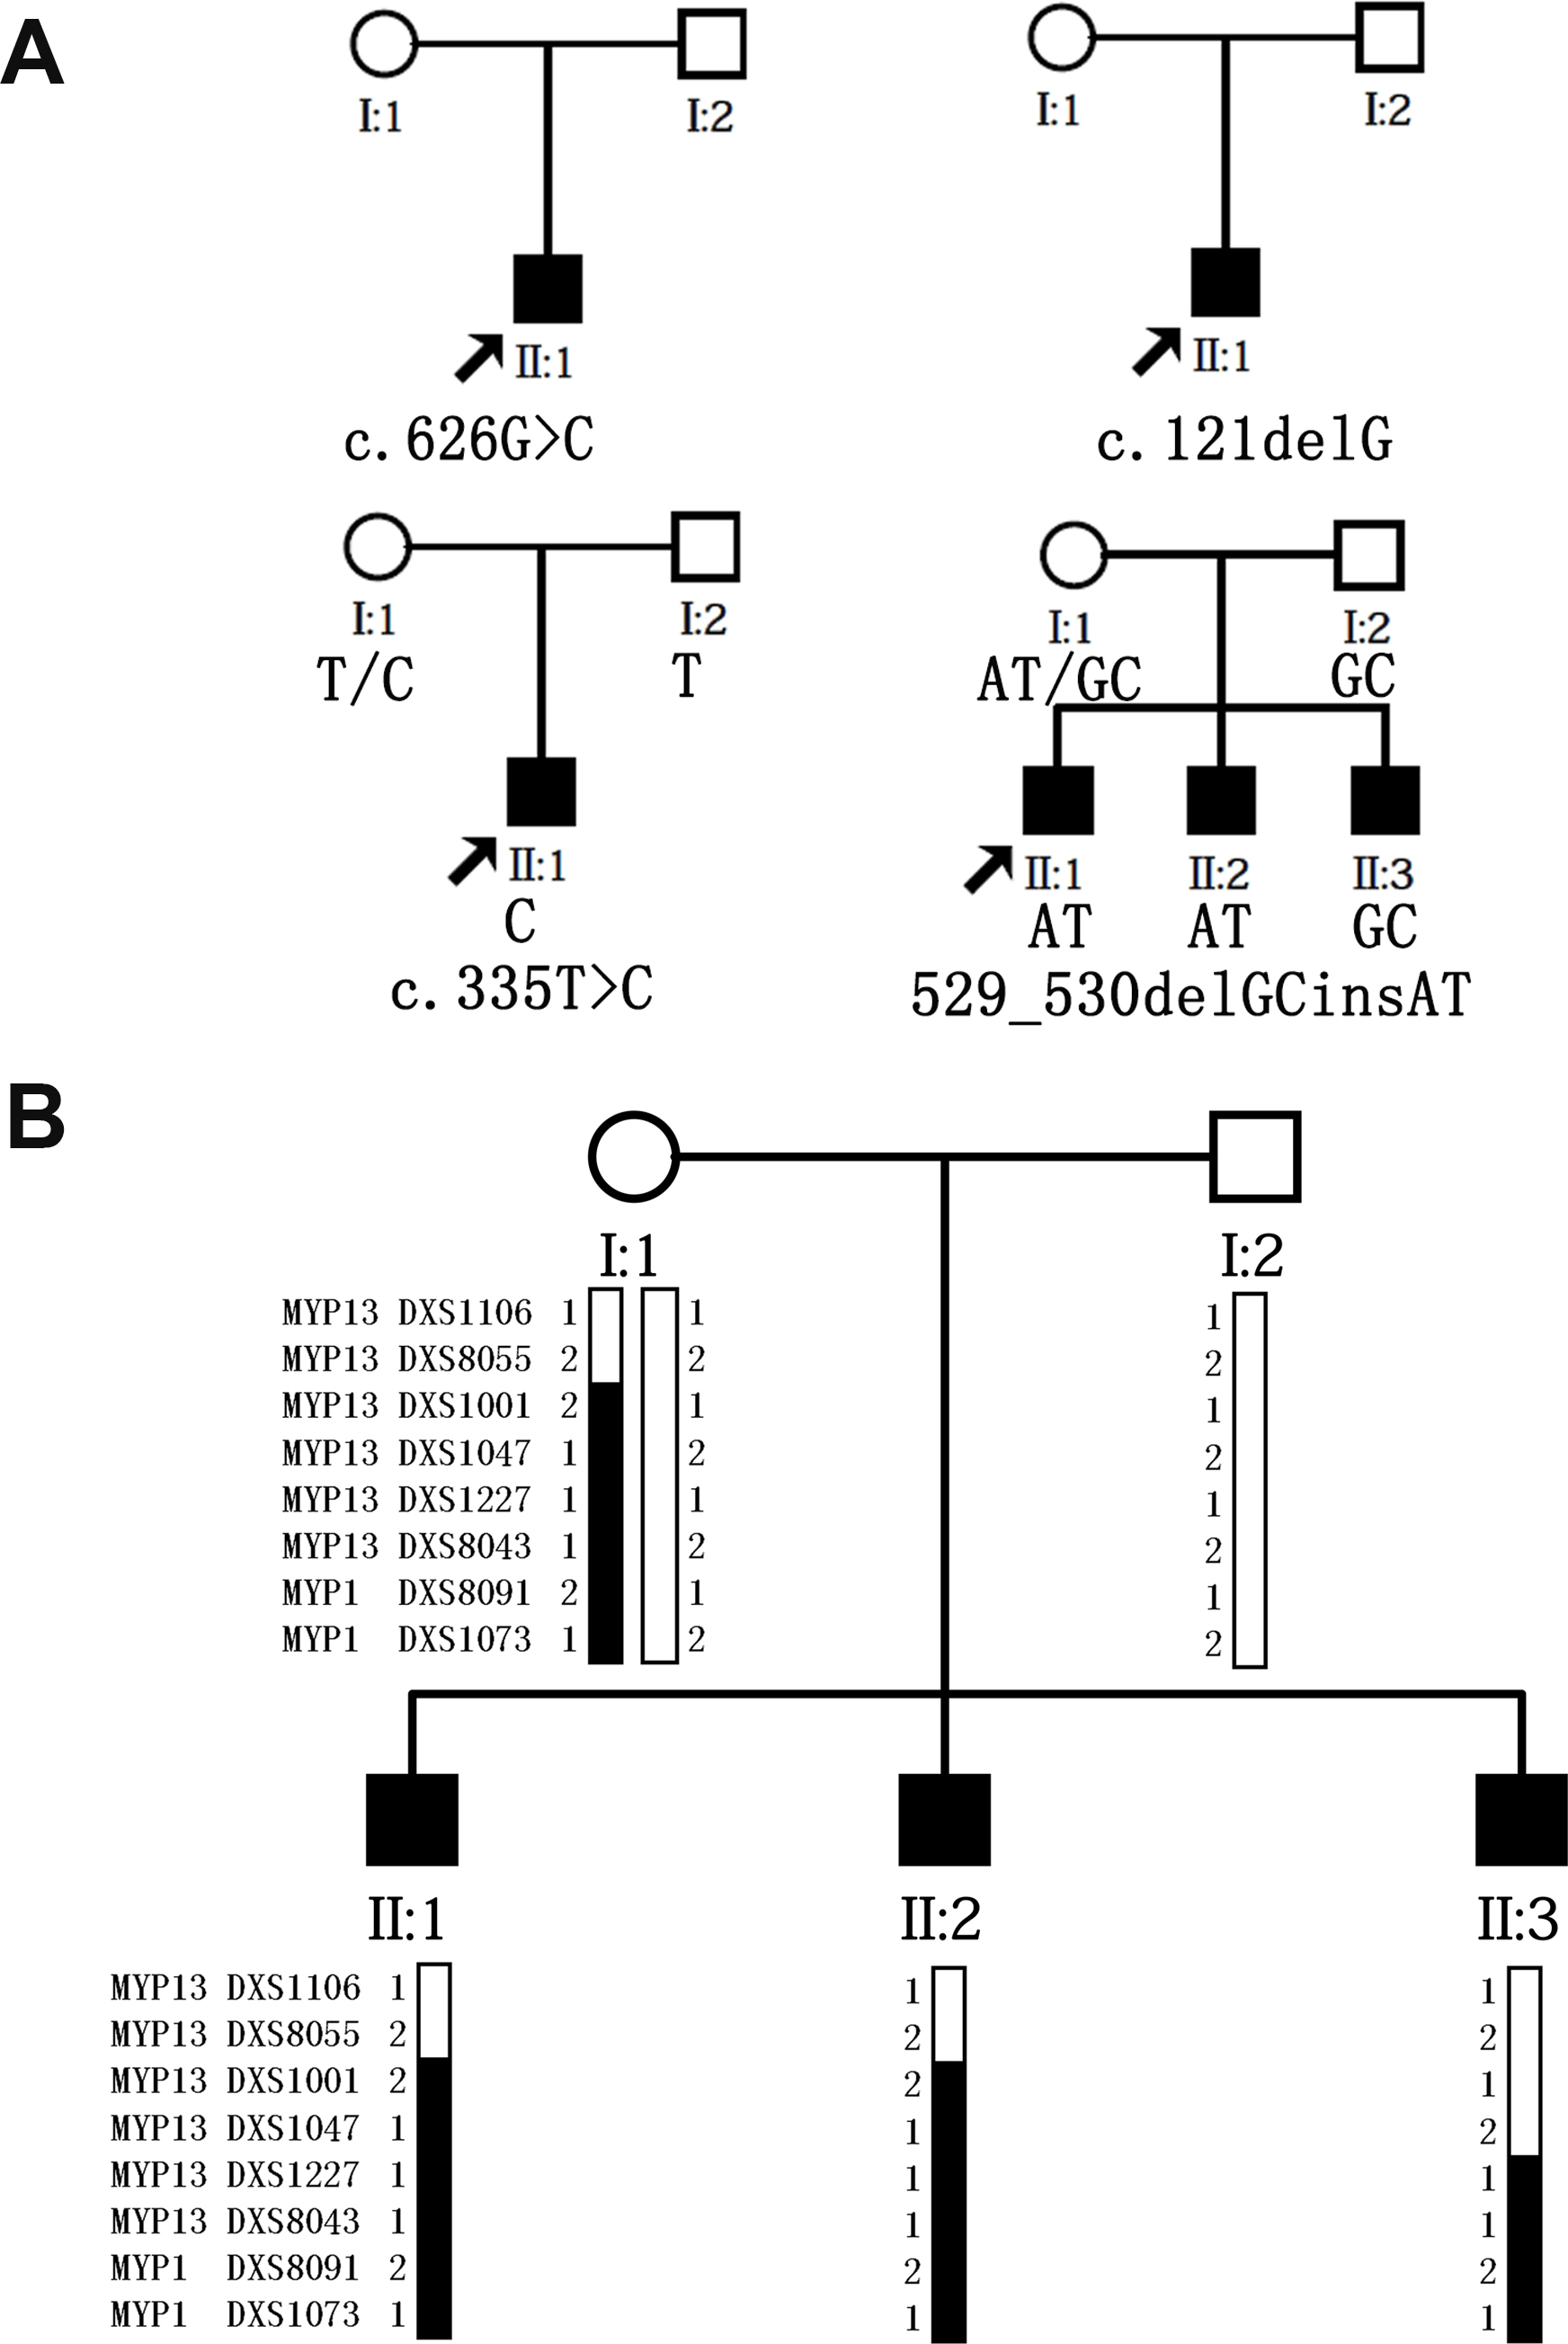
 Figure 2 of
Zhou, Mol Vis 2015; 21:213-223.
Figure 2 of
Zhou, Mol Vis 2015; 21:213-223.