Figure 6. Calcein AM assay of TM cells following treatment with lipopolysaccharide (LPS), dephosphorylated lipopolysaccharide (LPS-p),
and naloxone. Trabecular meshwork (TM) cells were treated with TLR4 agonist lipopolysaccharide (LPS; 100 ng), dephosphorylated
lipopolysaccharide (LPS-p; 100 ng), and the TLR4 inhibitor naloxone (100 µM) alone or in combination. Error bars are presented
as ± standard error of the mean (SEM), ***p<0.0001 with respect to PBS (control), ††† p<0.0001 comparing LPS and LPS-p, ‡‡‡
p<0.0001 comparing LPS and LPS plus naloxone, ### p<0.0001 comparing LPS-p and LPS-p plus naloxone, §§§ p<0.0001 comparing
naloxone and LPS plus naloxone, ¶¶¶ p<0.0001 comparing LPS plus naloxone and LPS-p plus naloxone.
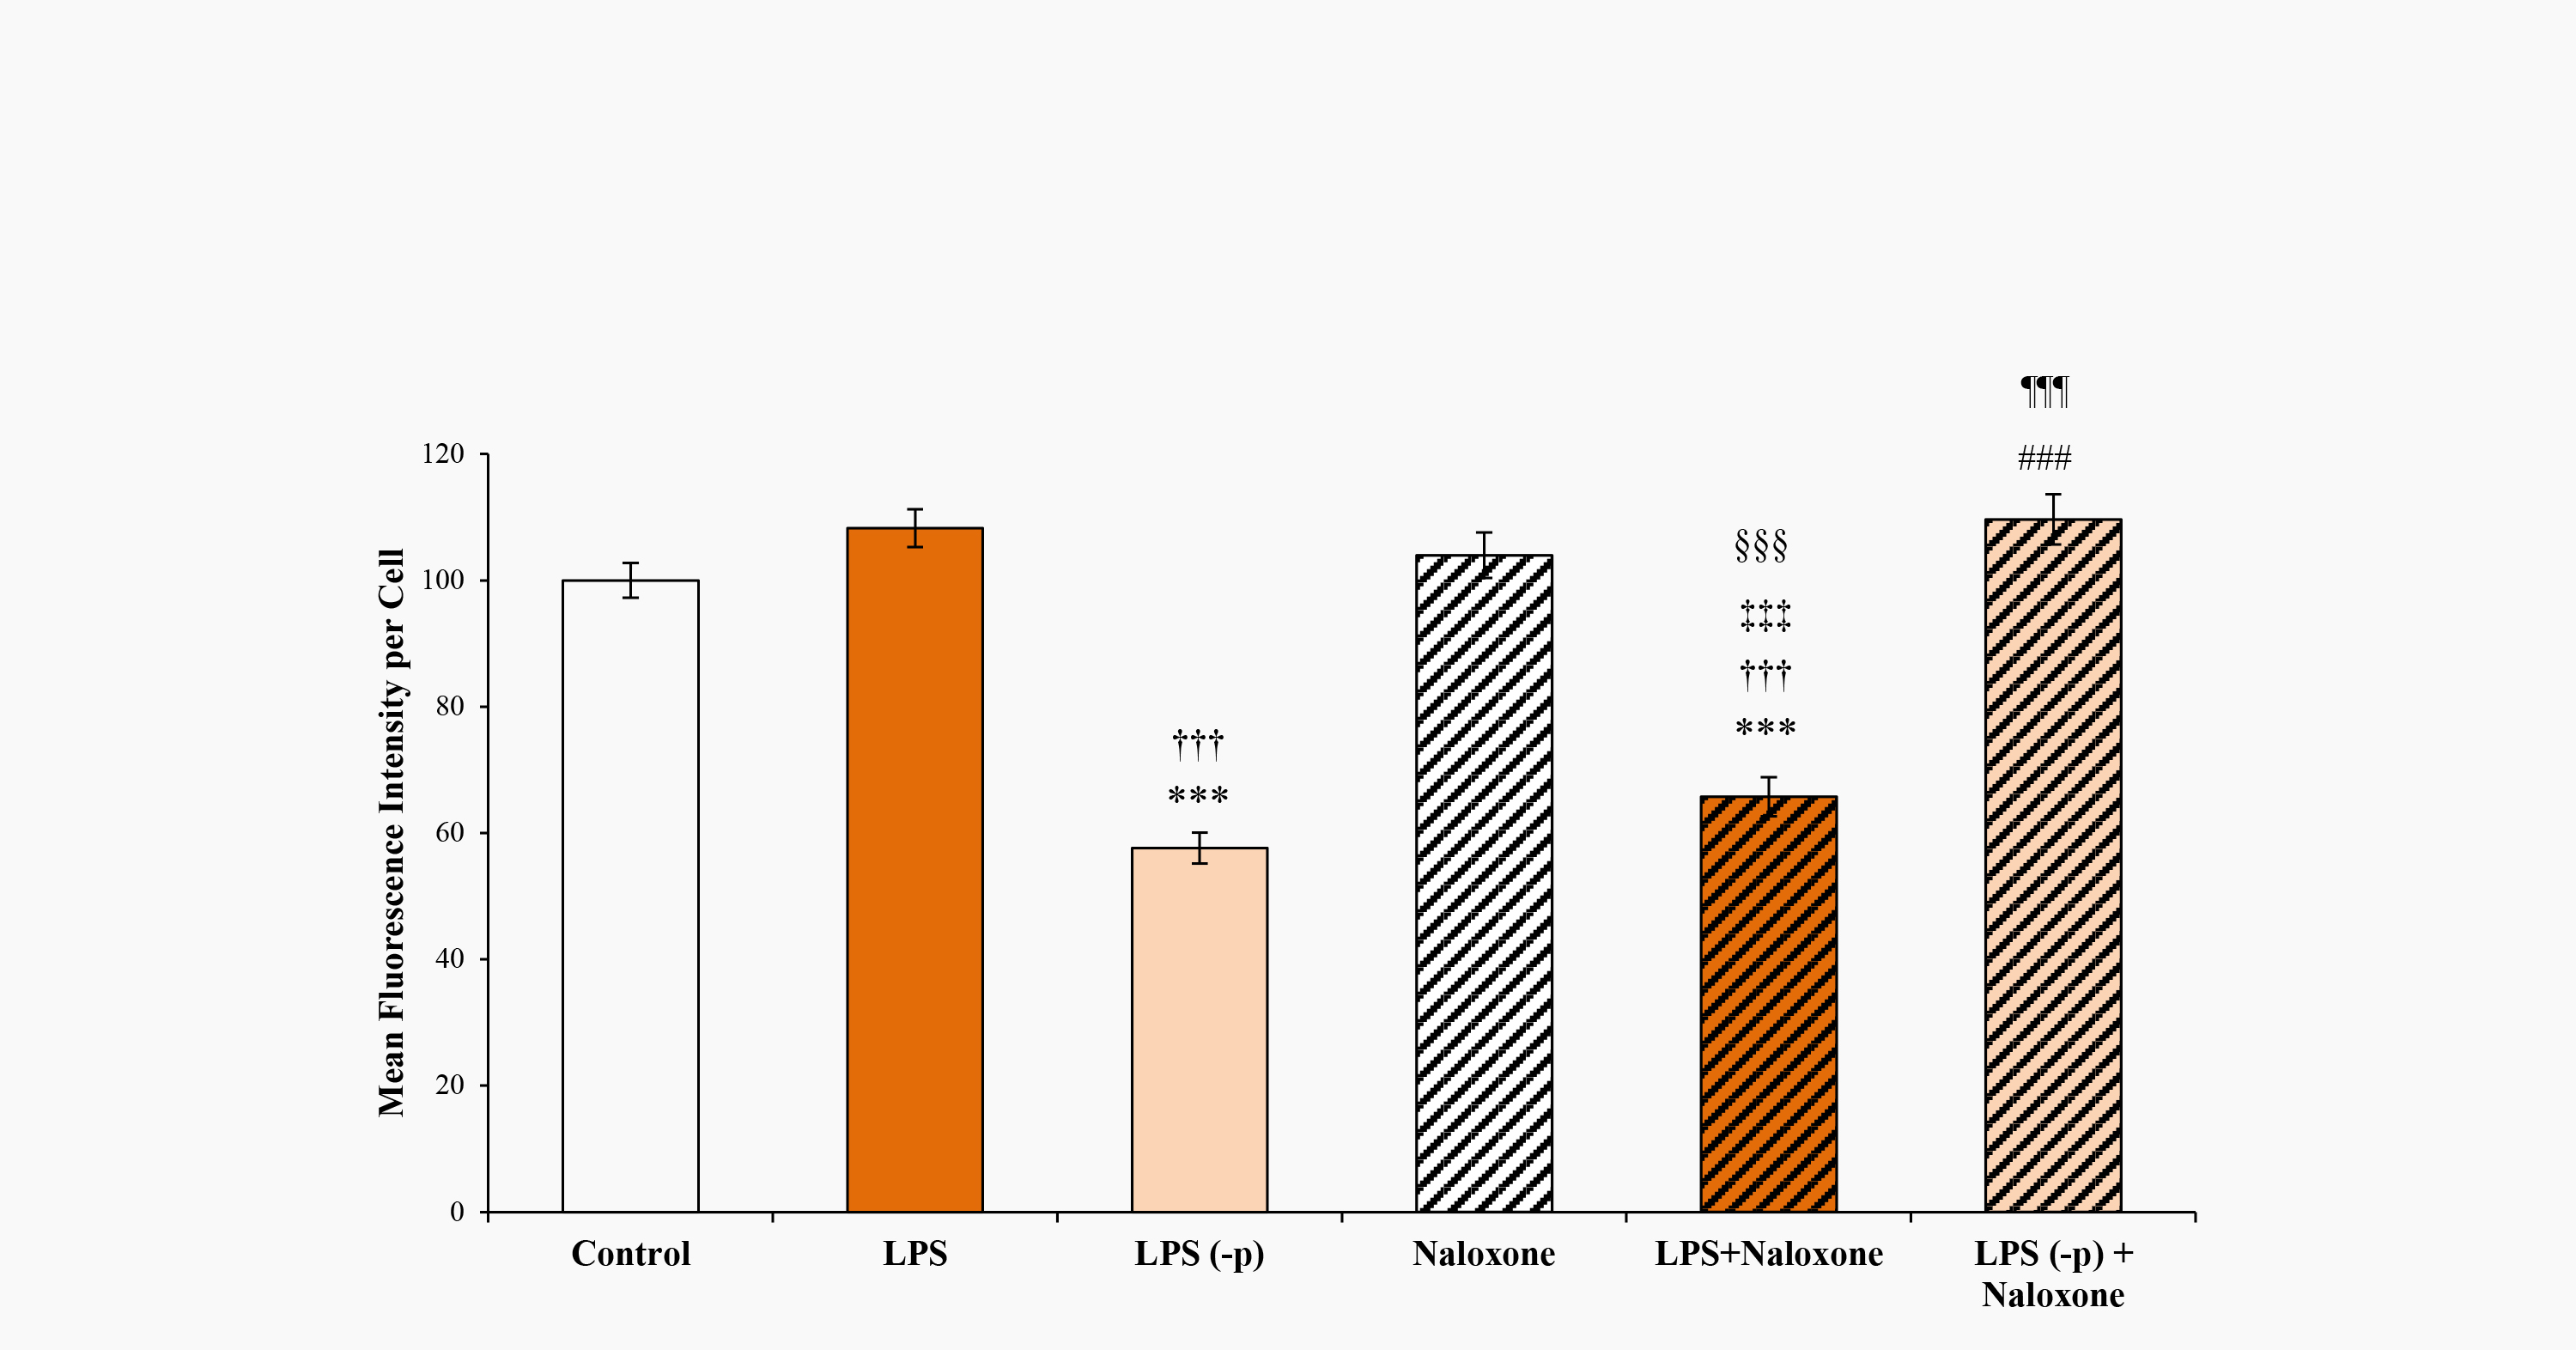
 Figure 6 of
Grybauskas, Mol Vis 2015; 21:201-212.
Figure 6 of
Grybauskas, Mol Vis 2015; 21:201-212.