Figure 4. Time course of calcein AM assay following lactate treatment in TM cells. The mean fluorescence intensity values of cells treated
with 100 µM verapamil, 1 mM, and 10 mM lactate, and PBS (control) for (A) 1 h, (B) 3 h, and (C) 6 h are presented. Verapamil-treated trabecular meshwork (TM) cells yielded higher levels of calcein retention compared
to the lactate-treated cells. Error bars are presented as ± standard error of the mean (SEM), *p<0.005, **p<0.001, ***p<0.0001
with respect to PBS (control); †p<0.05, ††p<0.01, ††† p<0.001 lactate compared to verapamil; ‡p<0.05 lactate (10 mM) compared
to lactate (1 mM).
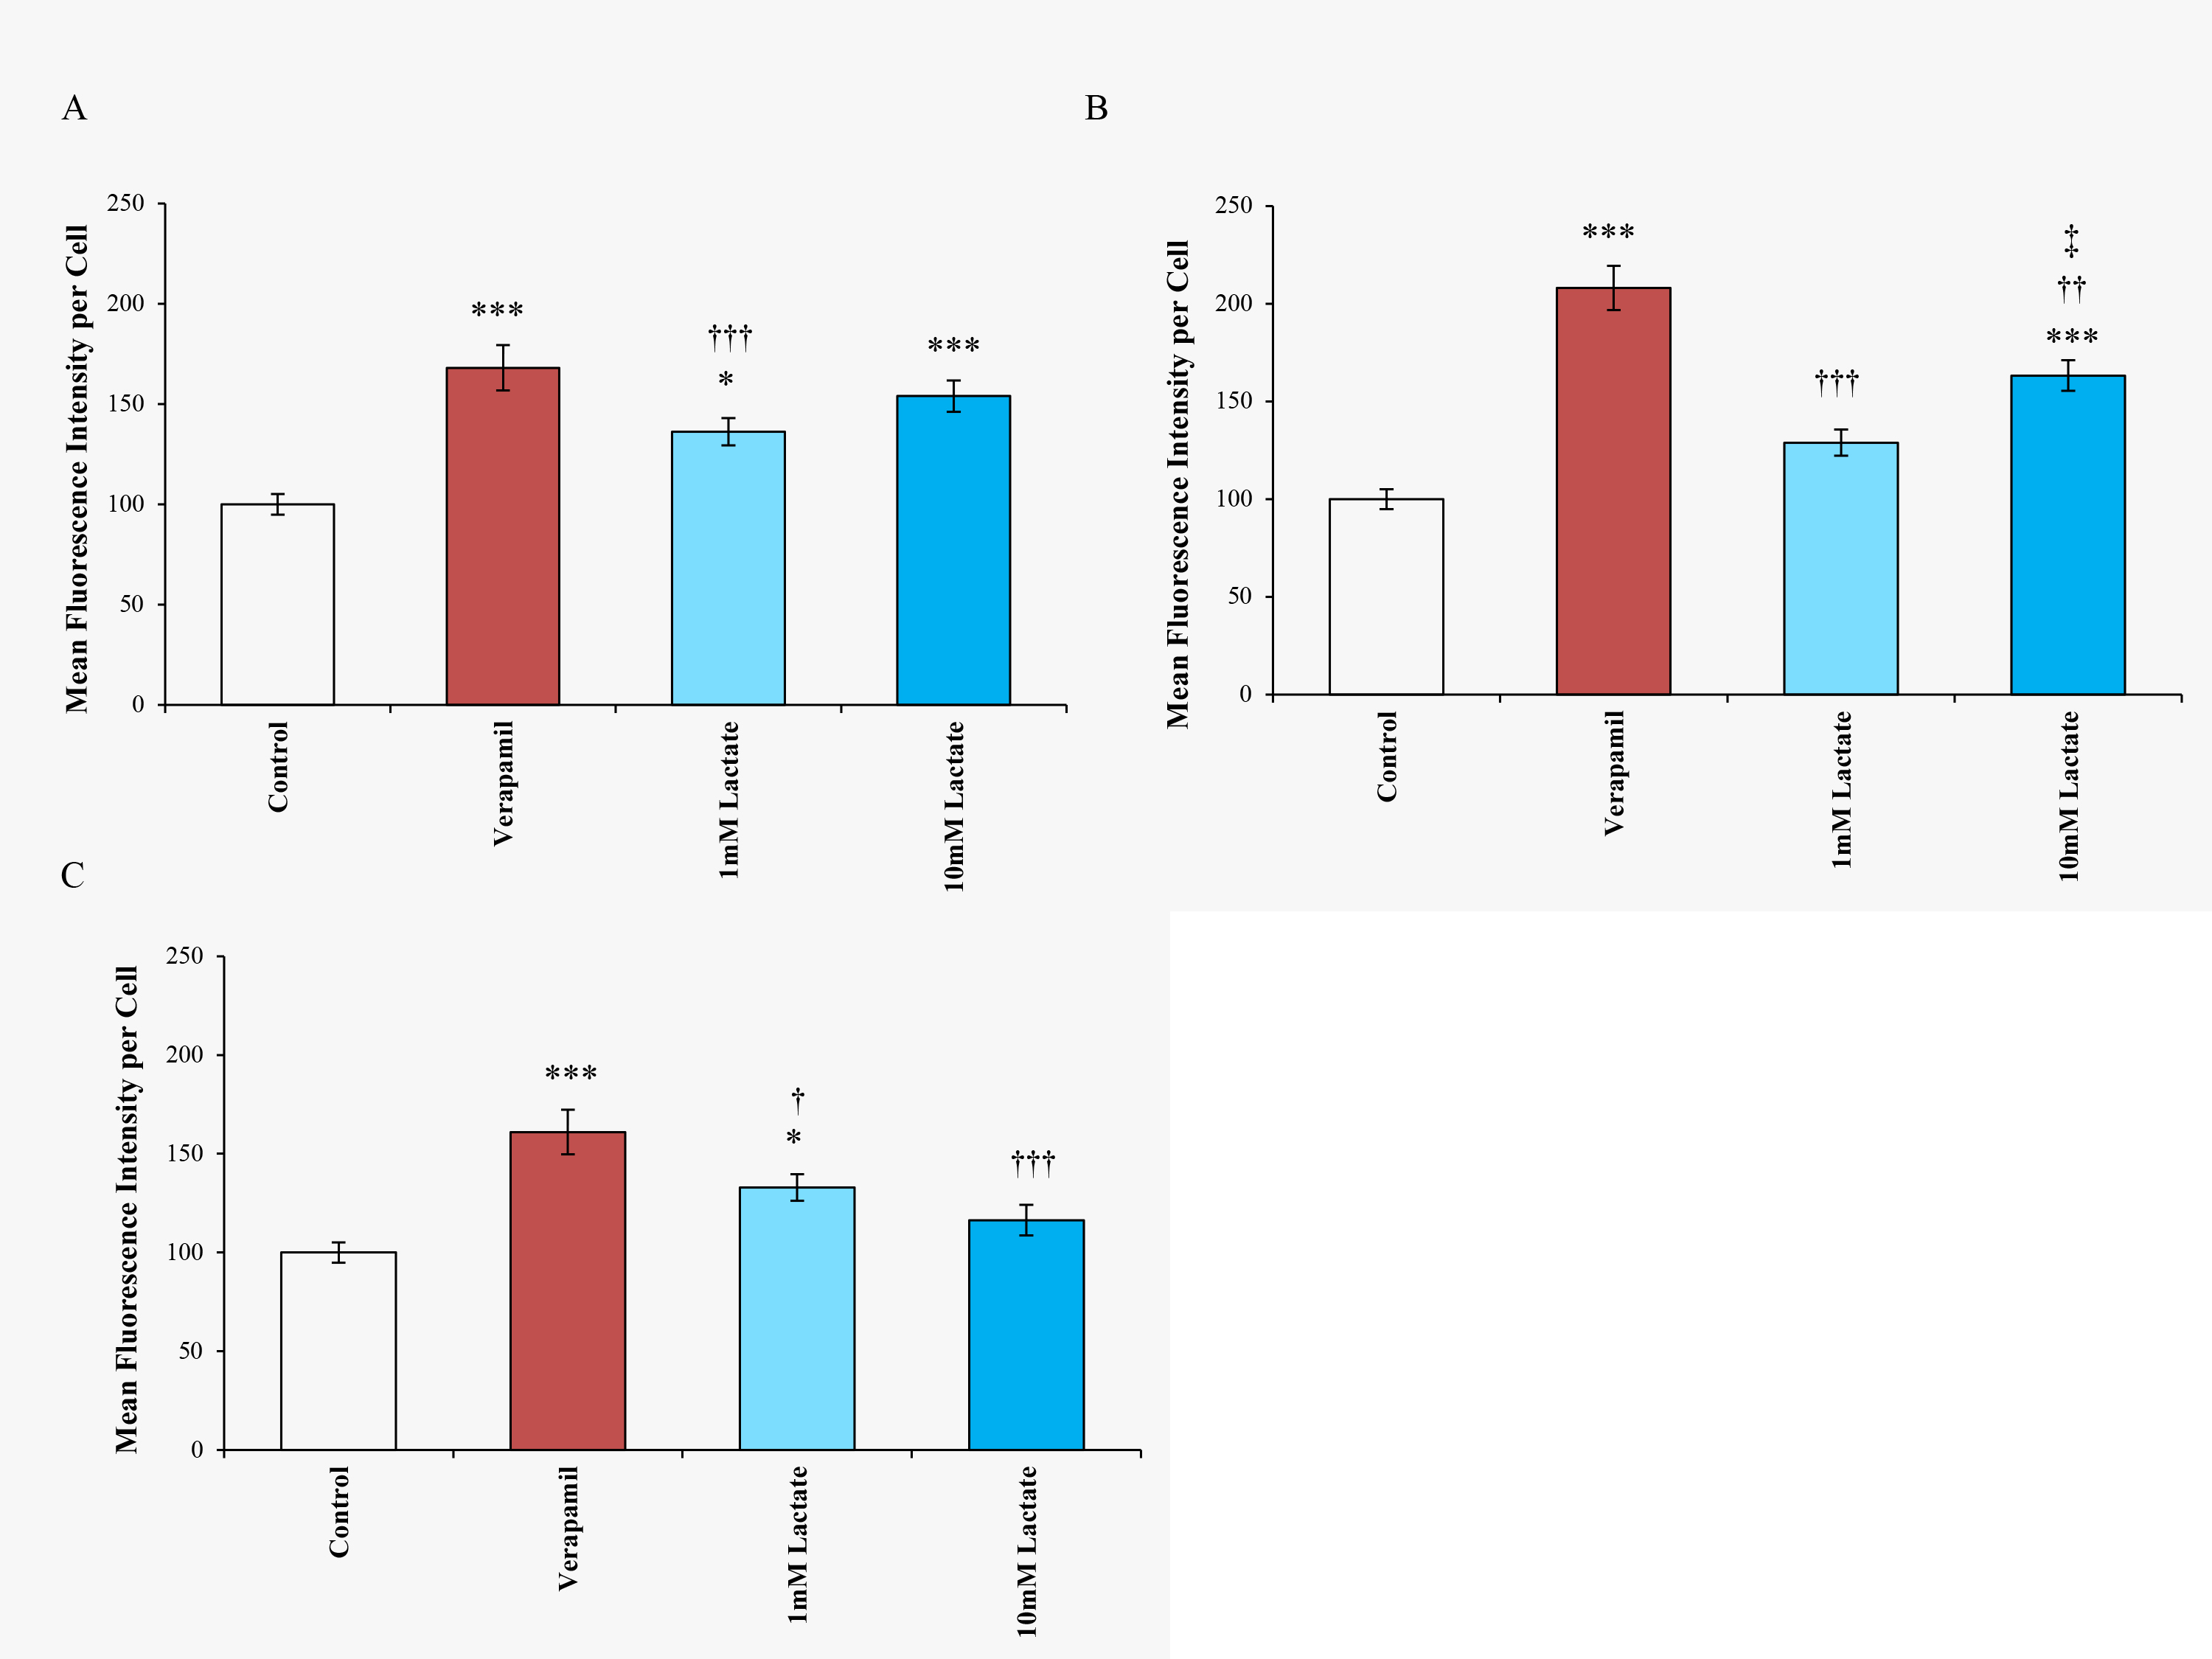
 Figure 4 of
Grybauskas, Mol Vis 2015; 21:201-212.
Figure 4 of
Grybauskas, Mol Vis 2015; 21:201-212.