Figure 3. Calcein AM assay following verapamil and digoxin treatment in TM and RAW 264.7 macrophage (RAW) cells. (A) Trabecular meshwork (TM) cells and (B) RAW cells were treated with PBS (control), 100 µM verapamil, and 50 µM digoxin. Error bars are presented as ± standard error
of the mean (SEM), **p<0.0005, ***p<0.0001 verapamil compared with PBS (control); †††p<0.001 digoxin compared with PBS (control);
###p<0.0001 digoxin compared with verapamil.
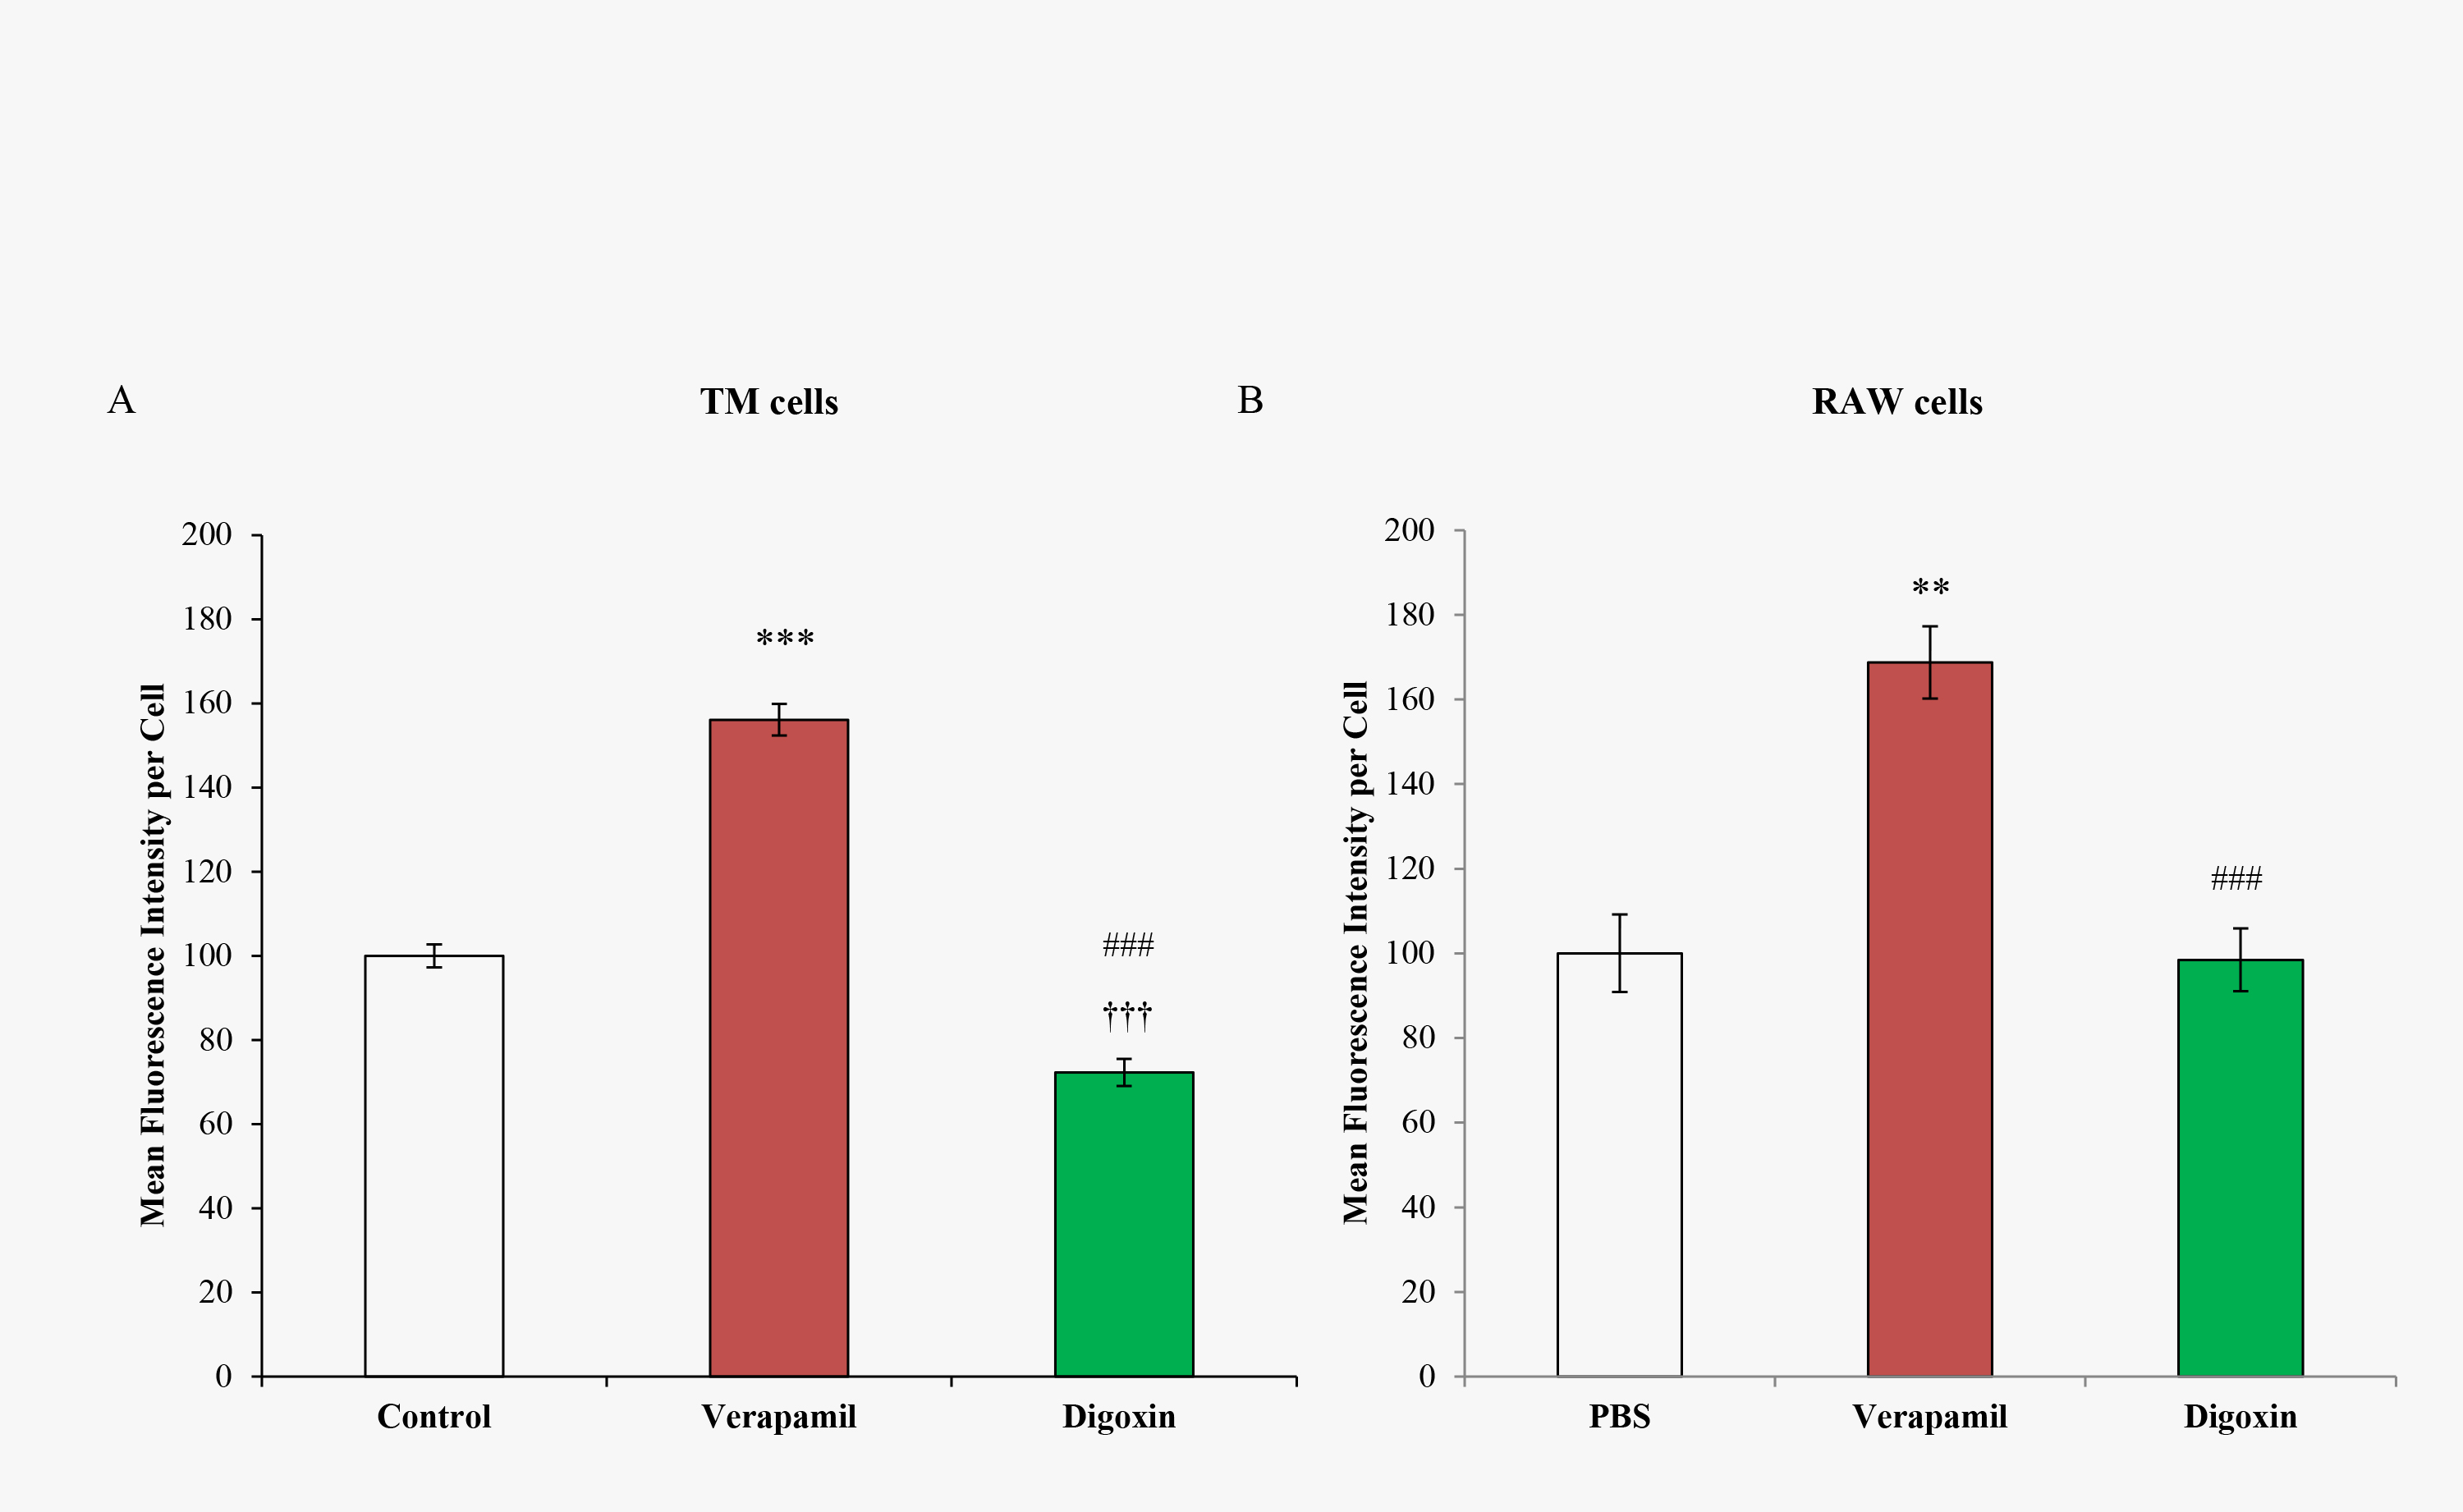
 Figure 3 of
Grybauskas, Mol Vis 2015; 21:201-212.
Figure 3 of
Grybauskas, Mol Vis 2015; 21:201-212.