Figure 2. Time course of calcein AM accumulation in TM cells evaluated with confocal microscopy. A: The calcein retention rate within trabecular meshwork (TM) cells following PBS (control) or 100 µM verapamil treatment.
B: Mean fluorescence intensity in PBS (control) and verapamil treated cells at the 30 min time point. Confocal microscopy images
were obtained in the middle of the TM cells with optical sectioning. C: PBS control at 5 min D: PBS control at 30 min time point. E: Verapamil at 5 min. F: Verapamil at 30 min time point. Error bars are presented as ± standard error of the mean (SEM), ***p<0.001.
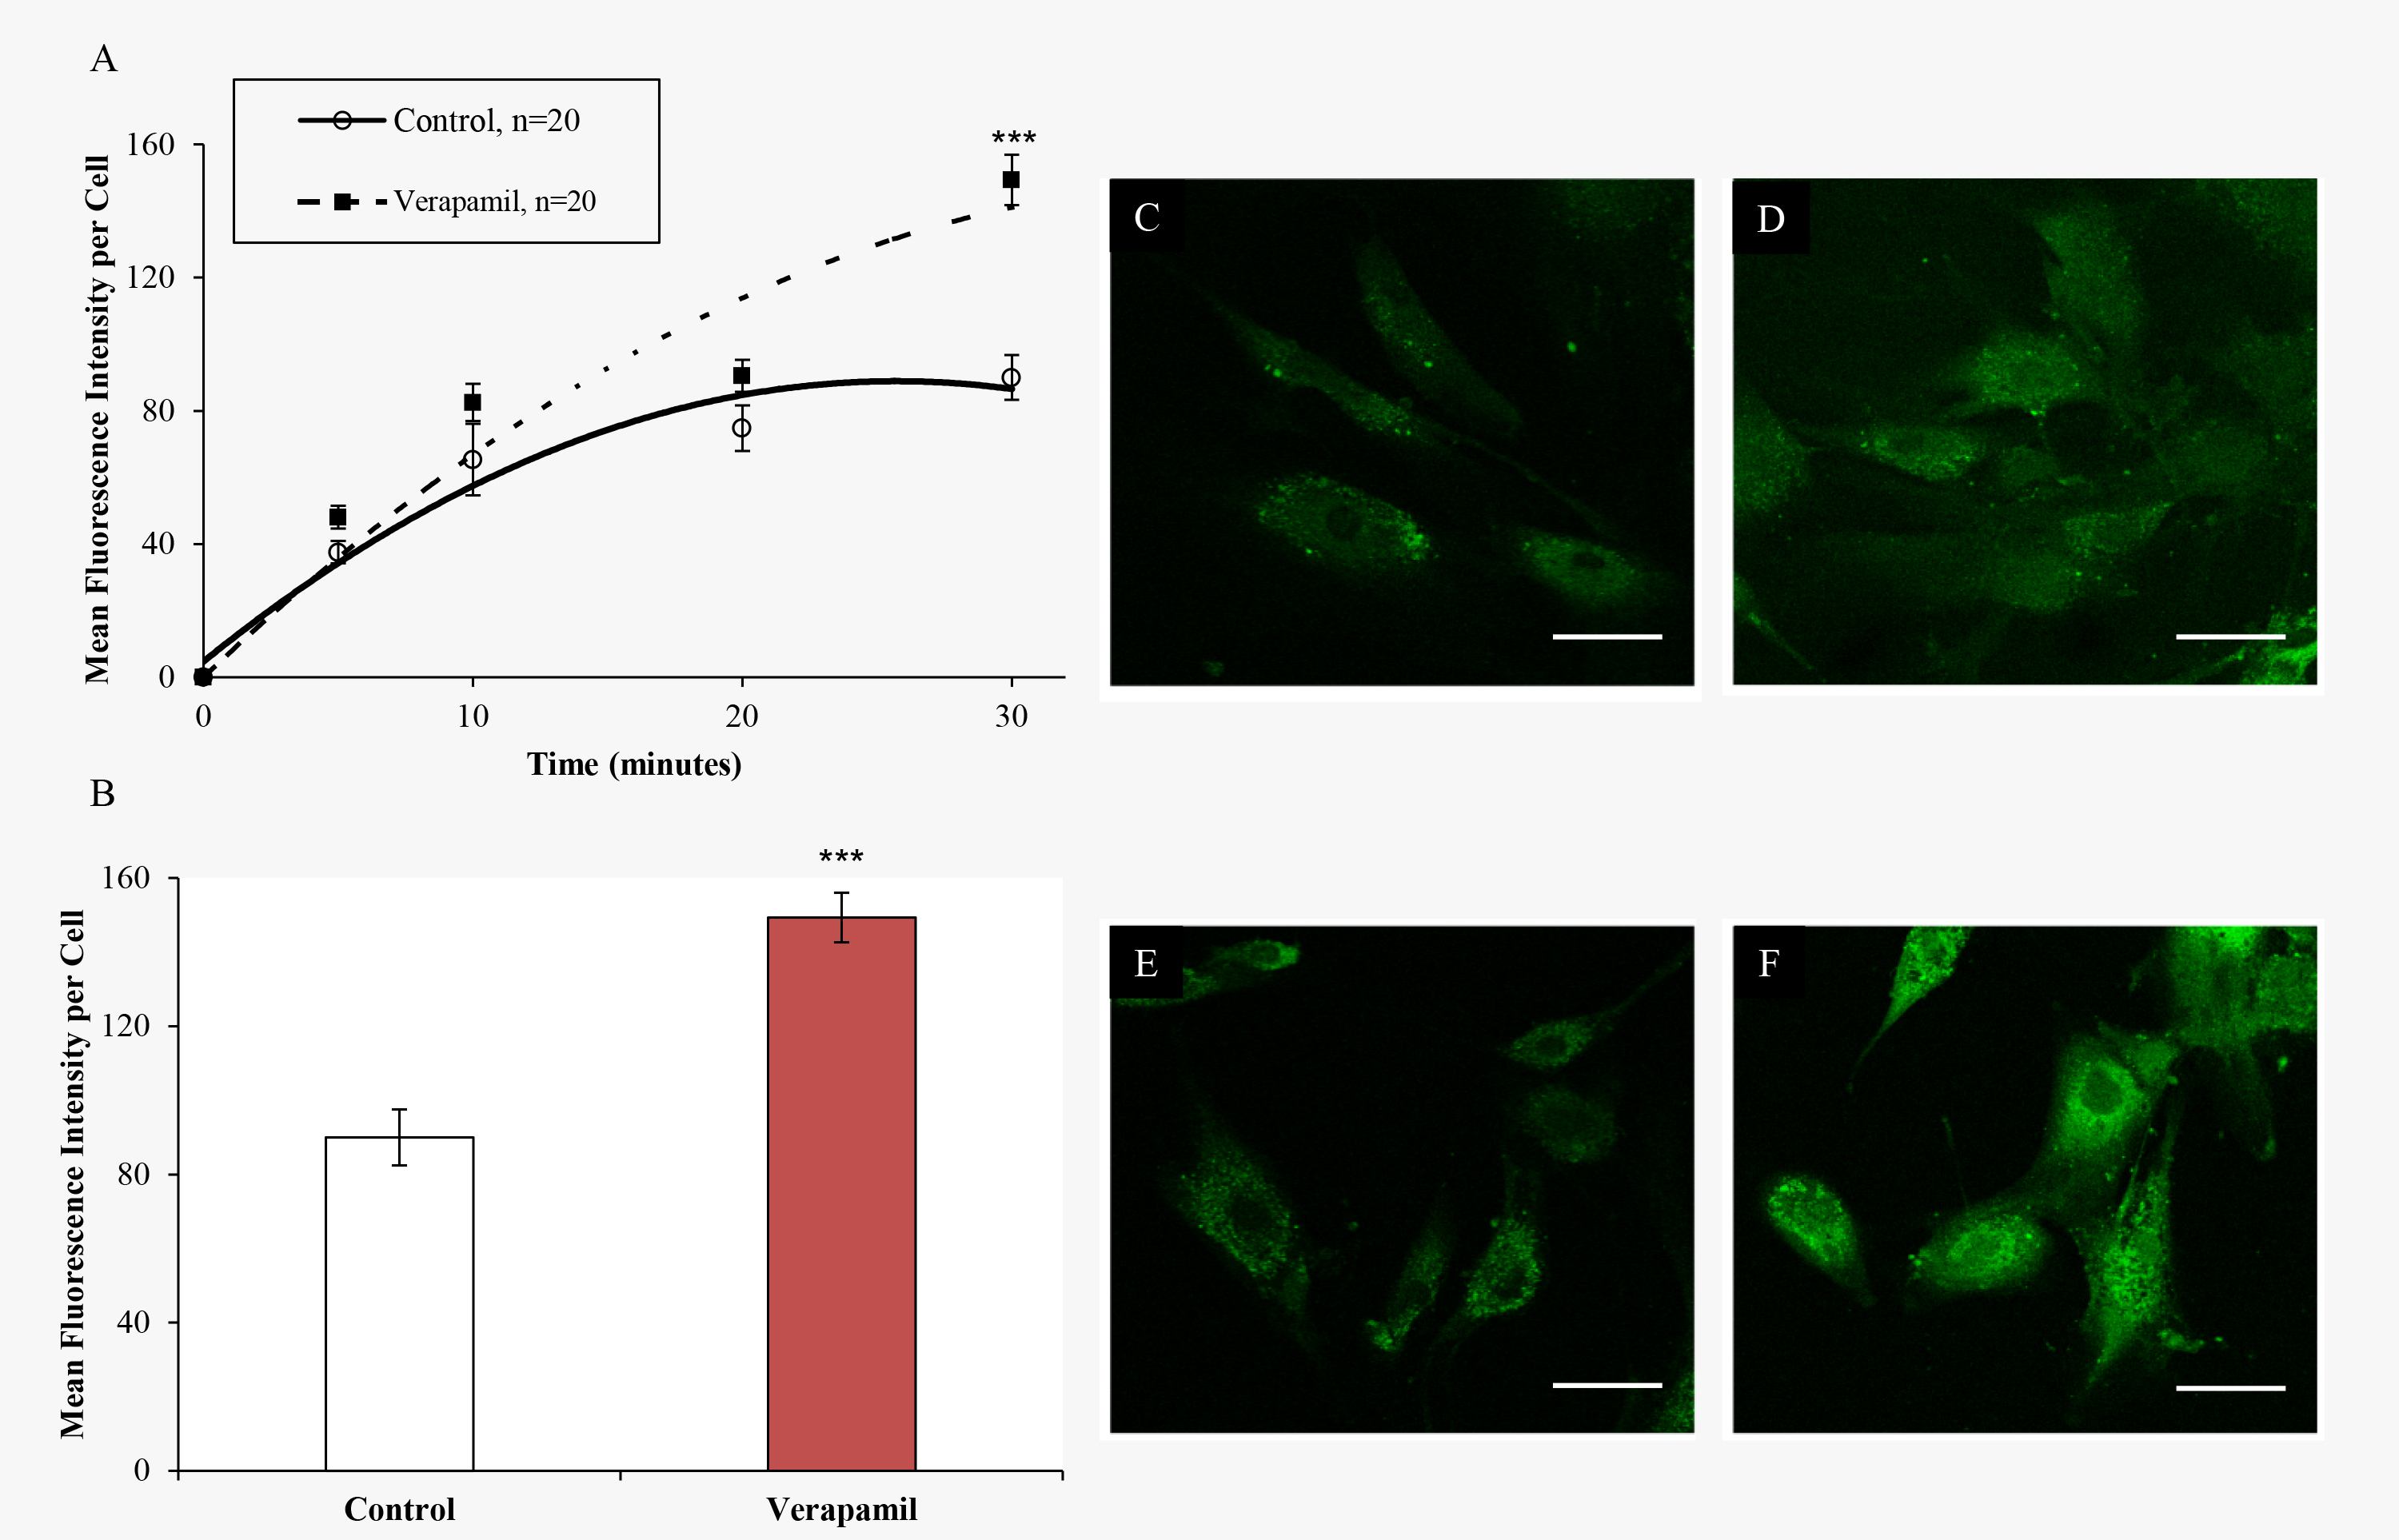
 Figure 2 of
Grybauskas, Mol Vis 2015; 21:201-212.
Figure 2 of
Grybauskas, Mol Vis 2015; 21:201-212.