Figure 5. Level of the total VEGF (free and combined forms of VEGF) in eyes after intravitreal injection of conbercept (KH902). A: Level of VEGF in the eyes of both the diabetic and control mice after intravitreal injection of conbercept. B: Level of the total VEGF in the eyes of both diabetic and control mice after intravitreal injection of PBS. C: Normalized level of VEGF in eyes of both the diabetic and the control mice after intravitreal injection of conbercept. D: Conbercept and normalized VEGF concentrations in eyes of both the diabetic and the control mice after intravitreal injection
of conbercept. One-way analysis of variance (ANOVA) followed by a Bonferroni correction was used for statistics. No significant
was identified between the two groups at any time point. Values represents mean±SD. (n=4 for each point).
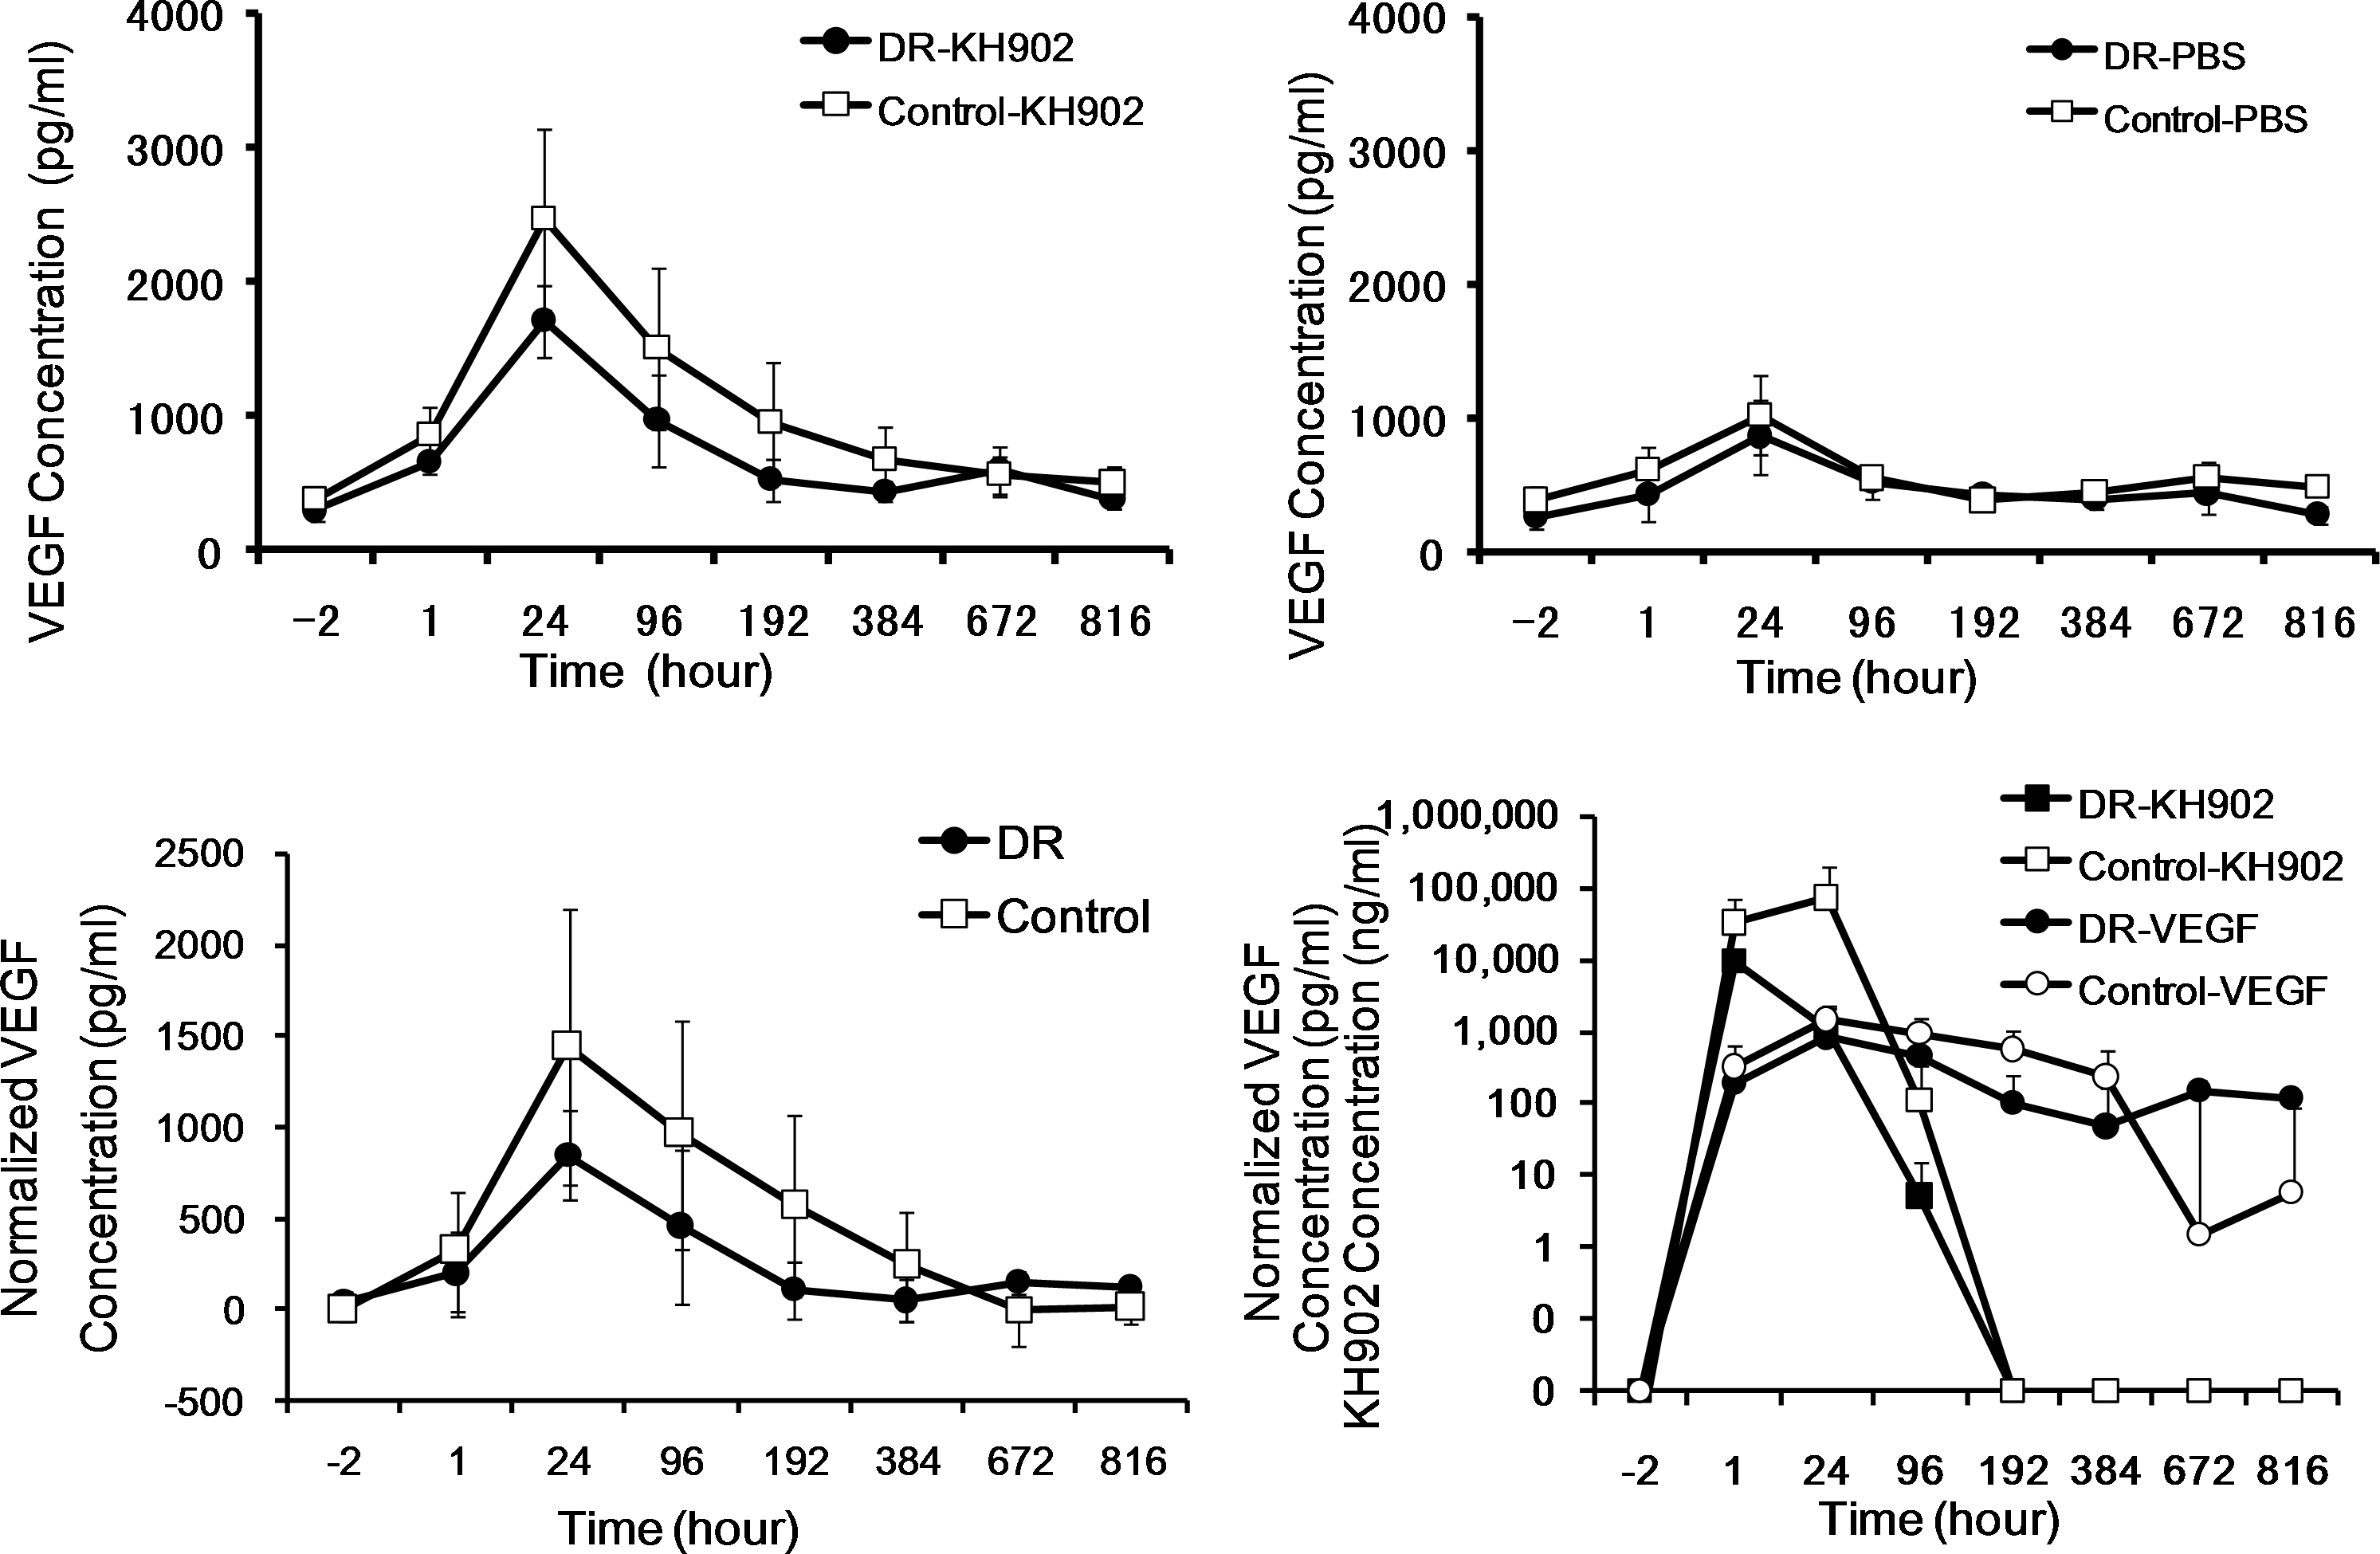
 Figure 5 of
Du, Mol Vis 2015; 21:185-193.
Figure 5 of
Du, Mol Vis 2015; 21:185-193.