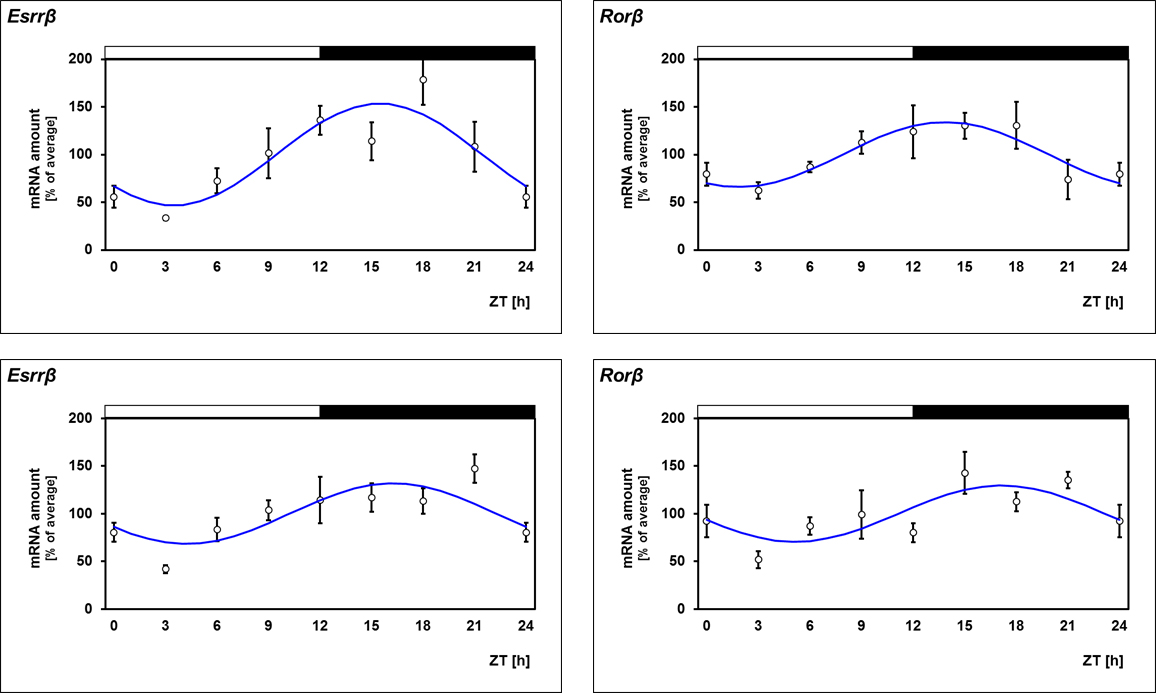
Figure 5. Comparative 24-h profiling of
Esrrβ and
Rorβ in the retina of melatonin-proficient (C3H/He,
rd+/+; upper line) and melatonin-deficient mice (C57BL/6J; lower line). The mRNA levels are determined by using quantitative PCR
(qPCR), and both are plotted as a function of Zeitgeber time (ZT). The blue lines represent the periodic sinusoidal functions
determined with cosinor analysis (only for p<0.05). The solid bars indicate the dark period. Data represent a percentage of
the average value of the transcript amount during the 24-h period. The value of ZT0 was plotted twice at ZT0 and ZT24. Each
value represents mean ± standard error of the mean (SEM; n=4). Statistical analysis of transcriptional profiling is provided
in
Table 6. Note that daily rhythmicity of
Esrrβ does not depend on a pulsatile melatonin signal.
 Figure 5 of
Kunst, Mol Vis 2015; 21:173-184.
Figure 5 of
Kunst, Mol Vis 2015; 21:173-184.